Introduction
Line plots
Multiple histograms
Other plot types
Instruction
Alright, your task is to draw a figure with two plots!
Exercise
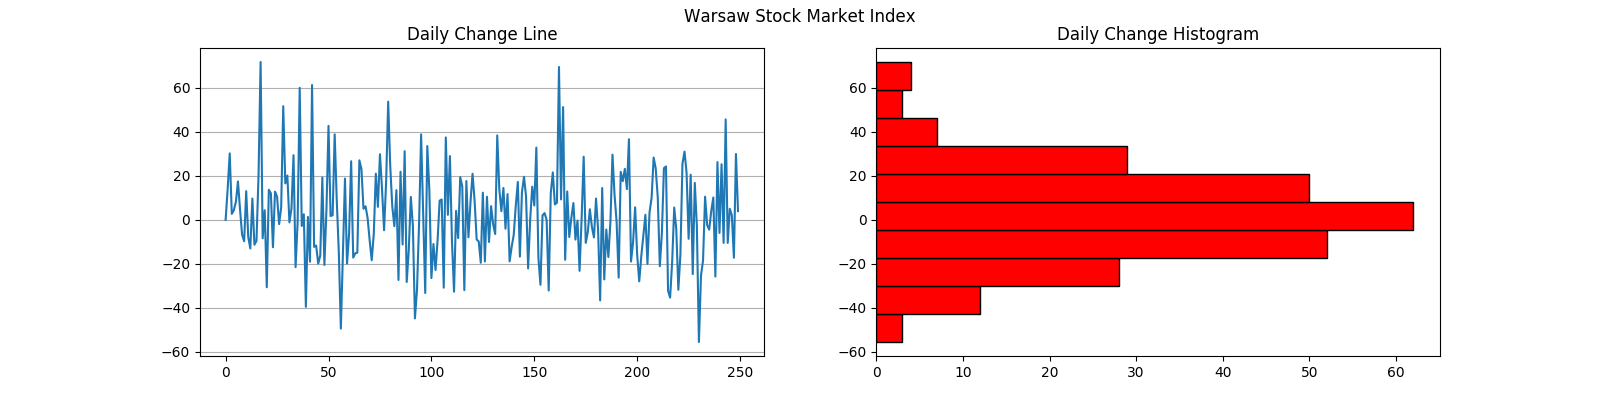
You are given the day-to-day changes of stock market index values in 2017 for the top 20 companies of the Warsaw Stock Exchange. Your task is to prepare the following figure:
To do so:
- Use the
stock_index.csvfile. It contains three columns:Date,IndexandChange. You are only interested in the last column. - Use 16x4 dimensions when you create the figure.
- To rotate the histogram, use
orientation='horizontal'as one of the arguments ofhist(). - Do not set the color of the first subplot – this color is set by default in matplotlib.

