Introduction
Line plots
Multiple histograms
Other plot types
Instruction
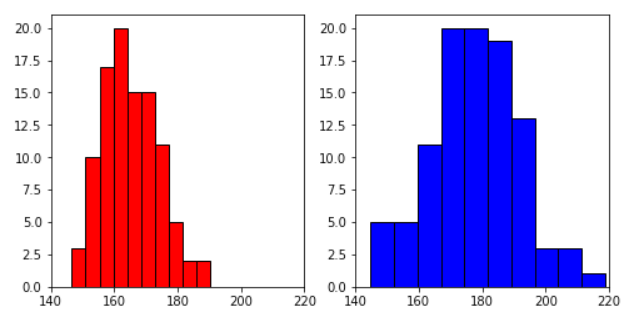
Great! We would like to easily compare the height distribution for men and women, which means that the x-axis should have the same limits in each subplot. We can use the following code:
subplot1.set_xlim([140, 220])
subplot2.set_xlim([140, 220])
The code above will make the x-axis start at 140 (centimeters) and end at 220 (centimeters) in both histograms:
Exercise
Add the same x-axis limits for all histograms: from 900 to 20000.
Stuck? Here's a hint!
To set the values for the first plot, use:
subplot1.set_xlim([900, 20000])

