Instruction
Good, matplotlib is a powerful library with lots of options, and we could devote an entire course to data visualization. Here, we will just touch upon the subject by creating line plots and histograms.
To start our adventure, we need to import matplotlib:
import pandas as pd
import matplotlib.pyplot as plt
Apart from pandas, we also added one new line:
import matplotlib.pyplot as plt
This imports the actual library. pyplot is a specific module of the matplotlib library. There are a few other options out there, but pyplot is the most widely used module.
Exercise
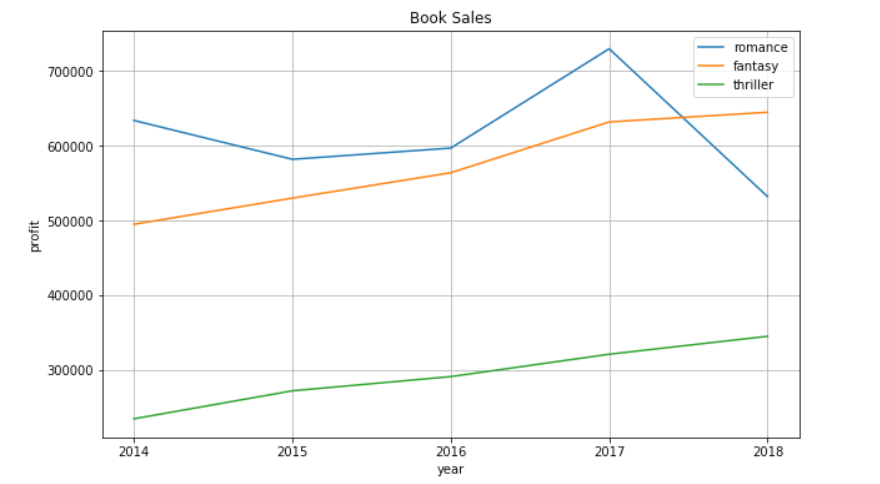
Your task in this section will be to import a dataset on book sales and create the following line plot (click on the image to enlarge it):
Start by importing pandas as pd and matplotlib.pyplot as plt. Next, create a DataFrame based on the books.csv file and assign it to the books variable.
Stuck? Here's a hint!
To read a csv file, use:
pd.read_csv('filename')
