Introduction
Line plots
Multiple histograms
Other plot types
Instruction
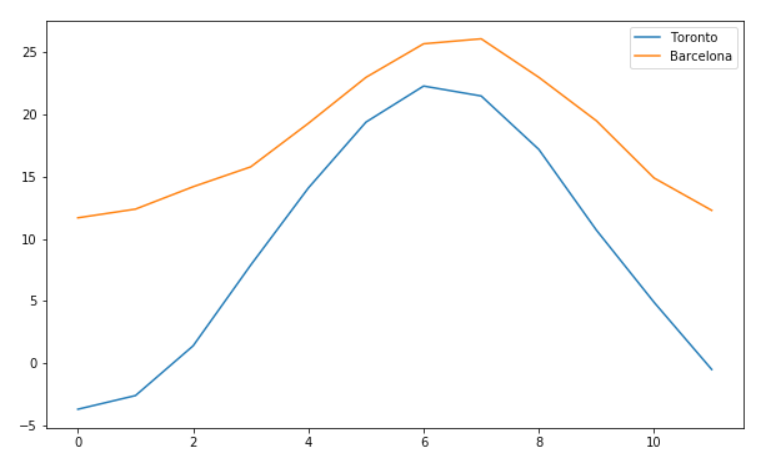
Good job! Our plot looks better now.
The problem is that two lines were drawn, but we don't know which one describes temperatures in Barcelona, and which one describes temperatures in Toronto. We need to add a legend. Luckily, this is extremely simple:
...
subplot.legend(loc = 'upper right')
In the code above, legend(loc = 'upper right') means that a legend will be added to the upper right corner of the subplot. Convenient, isn't it?
Exercise
Add a legend to the upper right corner of the subplot you created earlier.
Stuck? Here's a hint!
Provide
loc = 'upper right'

