Introduction
Line plots
Multiple histograms
Other plot types
Instruction
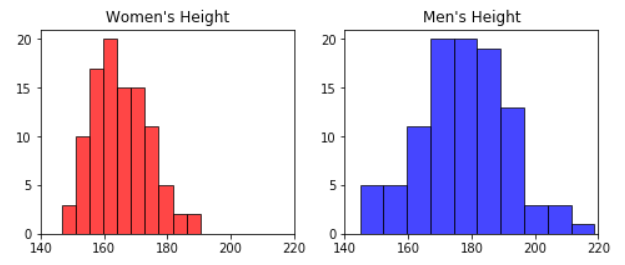
Great! Now, let's see how to create multiple subplots within a single figure.
This time, we'll use a dataset with the heights of 50 men and 50 women. You can check the contents on the right. We want to create two separate histograms: one for men, and one for women, as shown in the picture below:
Exercise
This time, you will be asked to analyze a dataset that contains salary information for people from three different departments: accounting, IT, and consulting. You will have to produce the following plot:
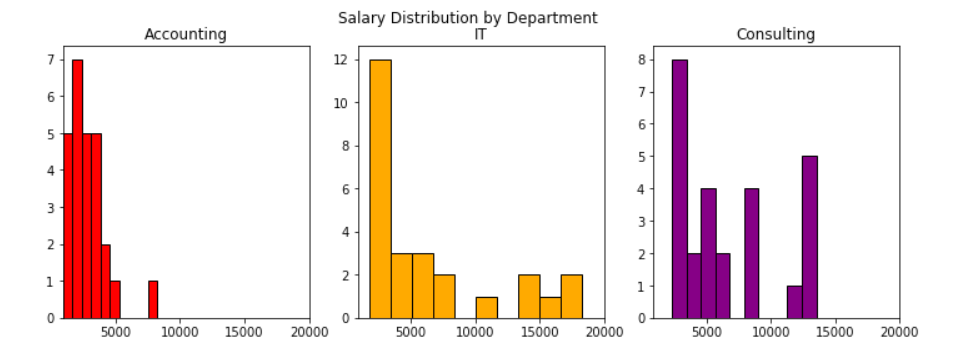
Start by creating the salaries variable and importing the salaries.csv file.

