Introduction
Line plots
Multiple histograms
Other plot types
Instruction
Great! First, we need to create a figure:
figure = plt.figure(figsize=(8, 4))
Previously, we simply created a subplot using plt.subplot(). This time, we'll use another method to add multiple subplots to the same figure:
subplot1 = figure.add_subplot(121)
subplot2 = figure.add_subplot(122)
You may be wondering about the mysterious numbers inside the parentheses – 121 and 122.
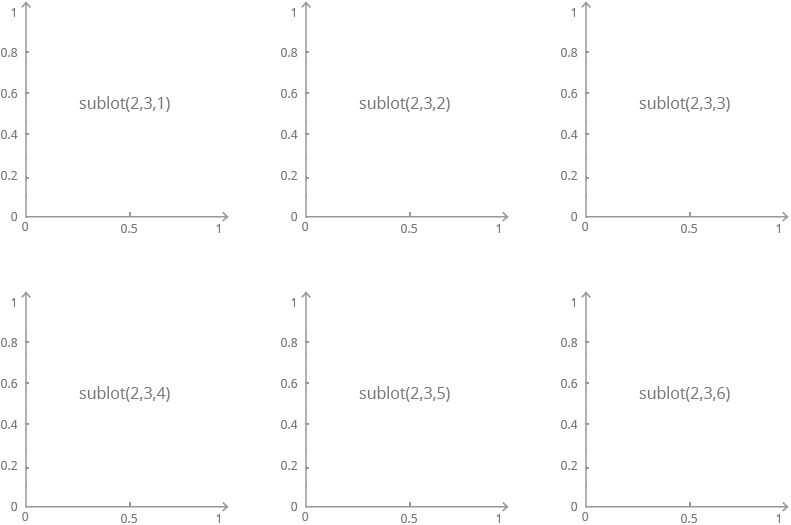
In general, add_suplot(xyn) (shorthand for add_suplot(x, y, n)) refers to a grid of subplots with x rows and y columns, and it creates a subplot at position n. Subplots are numbered from left to right in subsequent rows. For instance:
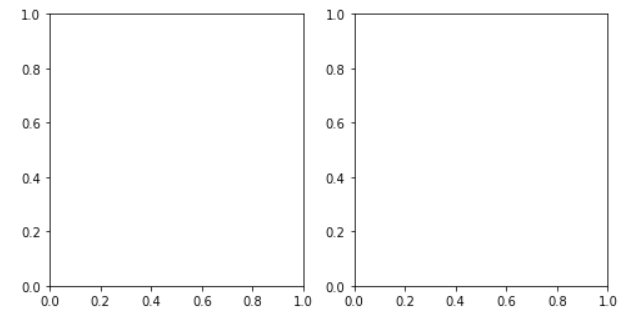
Now, in our code:
(121)is short for(1, 2, 1)and means: create a grid with 1 row and 2 columns, and place a subplot in the 1st column.(122)is short for(1, 2, 2)and means: create a grid with 1 row and 2 columns, and place a subplot in the 2nd column.
We will see the following result:
Exercise
Create a figure with dimensions 12x4, and add three subplots in a single row.
Stuck? Here's a hint!
To add the first subplot, use:
subplot1 = figure.add_subplot(131)

