Introduction
Line plots
Multiple histograms
Other plot types
Instruction
Great! Now that we have an empty subplot, it's time to draw some lines on it!
figure = plt.figure(figsize=(10, 6))
subplot = plt.subplot()
subplot.plot(climate['Toronto'])
subplot.plot(climate['Barcelona'])
plt.show()
Line 3 means: take the Toronto column from the climate DataSeries and plot a line with its values in the subplot. A single subplot can show multiple lines – below line 3, we also added line 4 with the Barcelona data. The result looks like this:
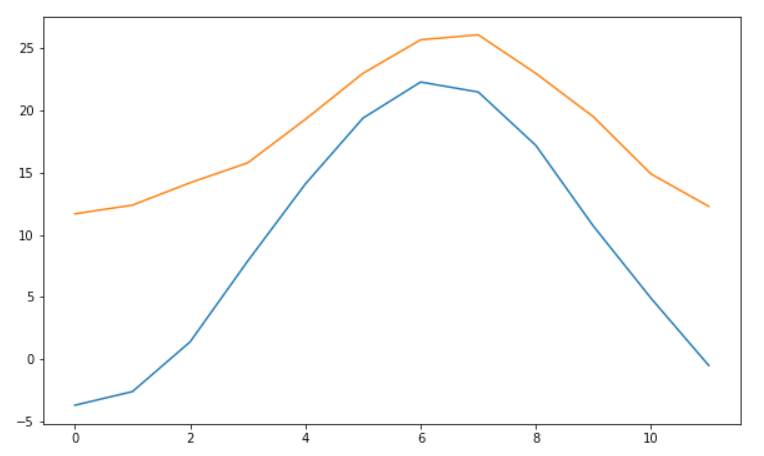
You can see that matplotlib changed our x-axis and y-axis to match the lines. That's a very convenient feature.
Exercise
Add three lines to the subplot:
- The first line is for romance books.
- The second line is for fantasy books.
- The third line is for thriller books.
Stuck? Here's a hint!
Create the first plot with:
subplot.plot(books['romance'])

