Data Visualization for Your Business: Does it Really Matter?

Our world is bursting with data—the new digital age has dynamically inflated the volumes of data collected by businesses worldwide. By 2020, about 1.7 megabytes of new information will be created every second for every person on the planet.
According to Forbes, The White House has already invested more than $200 million in big data projects.
Can you imagine that? Seriously!
Yet all the data that’s being generated by people, machines, online devices, and other sources doesn’t provide decision-makers with any valuable insights by itself. There’s loads of untapped potential in data.
To identify new business opportunities and make informed decisions, you need the ability to access, evaluate, understand, and act on data faster and more efficiently than ever before.
Data visualization: It’s time to Invest in the Big Data future
More than ever, business leaders today understand that data-driven decision-making is important and that a data-driven attitude can offer them a competitive edge.

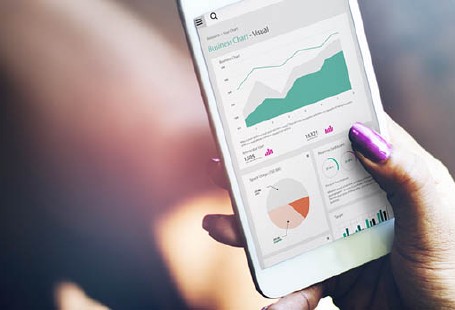
Data visualization involves communicating data in pictorial form to make it easier to understand. Visual representations help people identify underlying patterns, correlations, and outliers in the data.
Using technology, you can take the concept further to drill down into detailed graphs and charts, interactively changing the way you view and process data.
Data Visualization helps you:
- Visually explore key drivers for making informed business decisions.
- Uncover opportunities hidden in the data.
- Highlight key relationships, clusters, and outliers to reveal important insights.
- Create beautiful, interactive dashboards and reports.
- Review key performance metrics and share them with others.
Why does your business need Data Visualization?
In recent years, business intelligence (BI) and data have become critical parts of business success. Increasingly more business leaders now depend on data to make better decisions about systems products and customers.
While traditional BI tools were designed for either decision makers or a few market analysts, data visualization has made business analytics accessible to a wider audience.
Advanced predictive analytics makes it easy to evaluate possible outcomes and make sensible, data-driven decisions—with no technical background required. You get real-time snapshots of your business’s performance, with all the key metrics you need.
Regardless of their size or industry, all types of businesses use Data Visualization to help make sense of their data. Here’s how.
Understand data easily
Once the data is assembled and processed, it can be further streamlined by using graphs, charts, maps, tables, etc. Visual representation of numeric and text data helps you make sense of large volumes of data consistently—and draw outcomes.
Pinpoint patterns and relationships
Even enormous amounts of complex data start to make sense when presented with insightful graphics. The high-impact visualization of data helps you analyze and understand the underlying information so you can make informed decisions. Identifying intrinsic correlations helps you focus on the areas that can influence your key business objectives.
Identify emerging trends
Using data visualization to discover the market trends will give your business an edge over the competition. It’s a sure-shot way to improve your bottom line and easily identify spot outliers that affect customer churn or product quality. This helps you address the problems before they become major issues and serves as a roadblock for your business.
Communicate insights to others
Once the new insights from visual analytics are revealed, you can easily communicate them to your peers using graphs, charts, or other visually impactful data representations. It’s a great and engaging way to get your message across clearly and concisely.
How Data Visualization promotes creative data exploration
Because of the way your brain processes data, it’s easier to use graphs and charts to visualize large amounts of compound data than to review reports and spreadsheets.

Data visualization lets you correlate almost any data sources and work on them together, for improved and smoother analysis.
The ability to visualize data in several different ways—from gauge charts to area maps, pie charts, bar graphs, and more—makes content informative and all the more attractive.
These charts and graphs are then assembled in different business dashboards to convey data-driven messages effectively. You can easily view and analyze the rows and columns of a large amount of data through logical combination charts.
Data Visualization: What’s in it for you?
Informed decision-making is the foundation of a successful business. In the present situation, having access to the right data is like owning a gold mine, but unless you have the right tools to use it, the data remains underutilized or unutilized.
Data visualization unlocks the potential to provide new meaning to your data and exposes hidden information and trends that would otherwise go unnoticed. Insightful data helps you influence business decisions and exchange ideas with key industry players, which eventually leads to success.
Data visualization enables you to:
- Leverage Business intelligence and Big Data for your company.
- Know your target audience and understand the way it processes visual data.
- Understand the kind of information you want to communicate.
- Identify the data you want to visualize, including its cardinality (the inimitability of data values in a column) and size.
- Use BI to identify business drivers and convey the information in an easy form for your audience.
Unleash the true potential of Big Data
Data Visualization serves as a powerful discovery tool for businesses looking to glean creative insights from their data. Though there are several BI tools out there that provide data trends and relations, using them properly requires in-depth knowledge of statistics and data analysis.
At Vertabelo Academy, our Data Visualization course lays the groundwork for Business Intelligence. Our course prepares you to perform detailed analyses and glean insights from data, even if you don’t have any technical background. Try it before you buy it!


