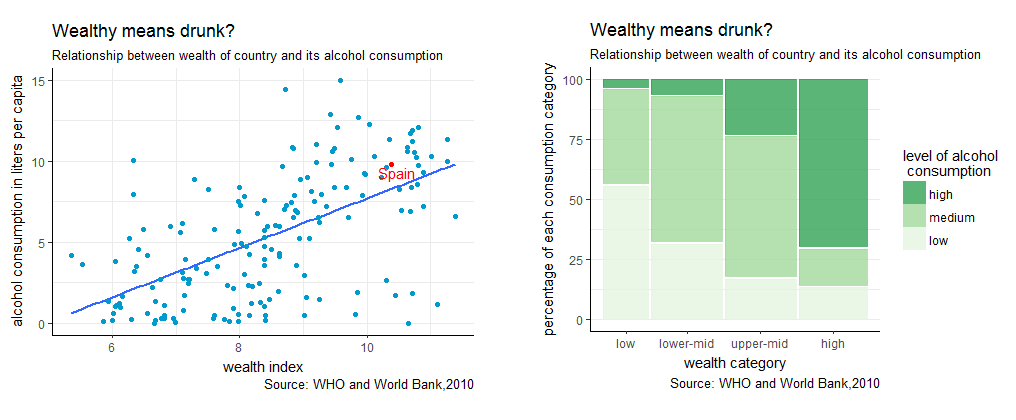
In Chapter 1, we analyzed the values a single variable can take. We will use a similar process now, but with two different variables at the same time. Specifically, we'll use a pair of numerical variables and a pair of categorical variables. Analyzing two variables lets us see their values as well as any relationship between them. In this chapter, we will answer questions like "Is one variable dependent on the other?"
As with Chapter 1, we'll divide this chapter into two parts, one for each type of variable. This means we'll create two types of charts: the scatter plot and the mosaic plot, which are presented below.