Congratulations! You have completed all the scatter plot exercises. Are you ready for the review?
In this section, we discussed visualizing the relationship between two variables. Specifically, we talked about how to use scatter plots to visualize the relationship between two numerical variables.
Use the following best practices to build your own scatter plots:
- The order of variables on a scatter plot is important. Put the explanatory variable on the horizontal x-axis and the response variable on the vertical y-axis.
- Add trend lines to show the relationship between variables.
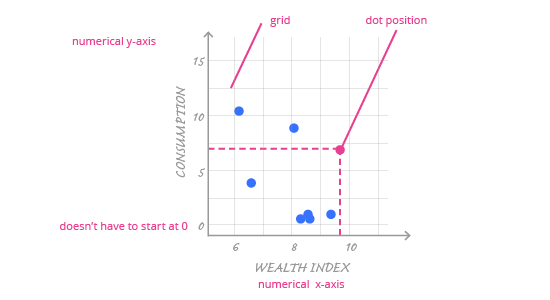
- Use a grid to help the reader understand numerical values.
- Remember: correlation does not mean causation.
- Add color to the points; it makes them stand out.
- To highlight data context, add labels to the chart.
Next up, we’ll look at visualizing relationships between two categorical variables using the mosaic plot.