We can deduce something about our data by analyzing the position of the dots. But can we say for sure that a relationship exists? Or do we just have random dots?
One way to establish a relationship is to measure it.
There are many ways to measure the relationship between data. The most popular is to establish the 'correlation' – the linear relationship – between the data values. There are nonlinear relationships as well, but we'll focus on the simpler linear ones in this course.
When we are discussing correlations, we can talk about:
- A positive correlation, where both variables' values increase together.
- A negative correlation, where the values of one variable decrease when another variable's values increase.
- No correlation – points are arranged more or less randomly.
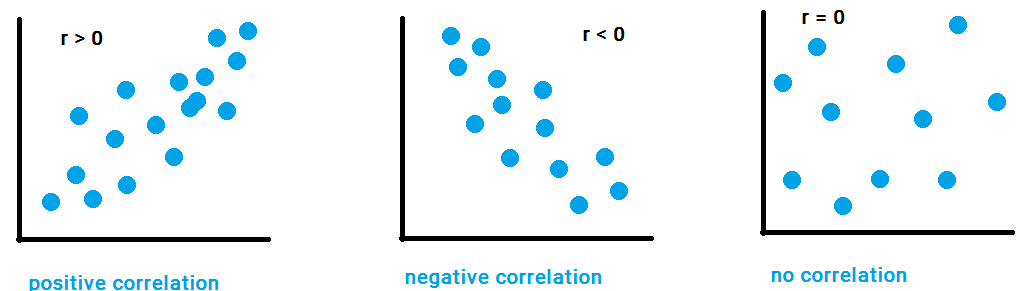
Correlation can be measured by the "correlation coefficient" (r). The exact formula for r isn't crucial for this course, but you can find it in our Statistics course. All you need to know about r is:
- It ranges from -1 to 1. Values above zero correspond a positive correlation, while values below zero show a negative correlation. Values at or very near zero mean no correlation.
- The closer the r value is to 1, the stronger the positive correlation is. The closer it is to -1 , the stronger the negative correlation is.
In our example, the correlation coefficient is 0.6, so it's a pretty high positive correlation.
