Why Learn the Tidyverse

Unfortunately, data isn’t always available in the exact structure you prefer. And there’s nothing more frustrating than having inconsistent, untidy data that produces biased results. Let’s take a look at how the Tidyverse can help.
What is Tidyverse?
Before you can conduct any analyses or draw any conclusions, you often need to reorganize your data. The Tidyverse is a collection of R packages built around the basic concept that data in a table should have one observation per row, one variable per column, and only one value per cell.
Businesses today use many versatile Tidyverse libraries like ggplot2, dplyr, tidyr, readr, purrr, and tibble to visualize and manage their data workflows. These packages work in harmony as part of a larger data analysis pipeline to clean, process, model, and visualize data.
Why is Tidyverse so popular?
Developed by RStudio’s chief scientist Hadley Wickham, the Tidyverse provides an efficient, fast, and well-documented workflow for general data modeling, wrangling, and visualization tasks.
The Tidyverse uses a consistent approach to build an ecosystem of applications. It loads a comprehensive suite of the latest data-handling tools into your R session and offers an essential toolbox for any data engineer using R. (Moreover, it’s a lot easier to add The Tidyverse library to your data script instead of making several separate library calls.)
By applying data science techniques using R programming and the different ecosystem packages (e.g., purrr, quantmod, etc.), we can analyze large datasets and quickly demonstrate the data governance frameworks using growth-to-consistency and reward-to-risk metrics.
The Tidyverse empowers:
- Data manipulation (dplyr, tidyr)
- Working with data types (stringr for strings, lubridate for date/datetime, forcats for categorical/factors)
- Data visualization (ggplot2)
- Data-oriented programming (purrr, tidyeval)
- Communication (Rmarkdown, shiny)
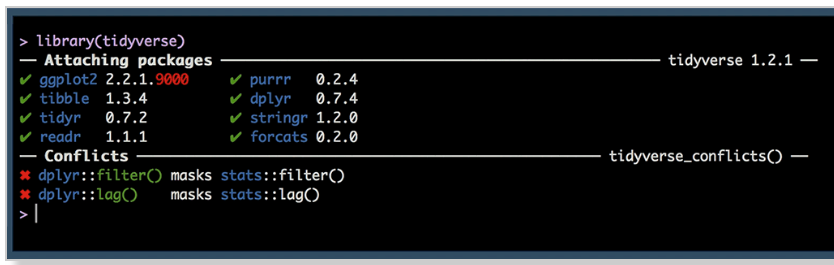
To install the Tidyverse, go into an R session and type:
install.packages("tidyverse")
Then, to load the Tidyverse packages (including dplyr) into your current R session, simply type:
library("tidyverse")
What makes Tidyverse unique?
So why should you use the Tidyverse packages rather than working in vanilla R—that is, R without any open-source libraries?
Vanilla R is not an easy programming language to master. The Tidyverse introduces a set of useful data analysis packages to help streamline your work in R. In particular, the Tidyverse was designed to address the top three common issues that arise when dealing with data analysis in R functions:
- Results obtained from a base R function often depend on the type of data being used.
- When R expressions are used in a non-standard way, they can confuse beginners.
- Hidden arguments often have various default operations that beginners are unaware of.
With tools like ggplot2 and dplyr, it’s now much easier to work with data in R.
The future of the Tidyverse
R is still evolving, and lots of advanced packages are being built right on top of the existing the Tidyverse infrastructure. The current focus is mainly on algorithms and data modeling. At the same time, the Tidyverse is being extended so it can cover financial (tidyquant) and text (tidytext) data.
Hadley makes it a point to regularly update the Tidyverse packages. In turn, users can update them via R installations. You can use the tidyverse_update() to do this.
Conclusion
Getting up and running with datasets can be difficult. You can easily get overwhelmed, and your biggest roadblock is knowledge (or lack thereof). Tidy data is essential—but without a proper understanding of data analysis, you won’t really know if your data is tidy. That’s why I recommend you to learn about Tidyverse and data opportunities that lay ahead:
- The interrelated concepts of data visualization and data manipulation through different tools like ggplot2 and dplyr.
- Data manipulation by sorting, filtering, and summarizing real datasets.
- Turning processed data into histograms, bar and line plots, and more with ggplot2.
Remember: If you want to succeed in data science, the Tidyverse should be on your bucket list!


