Descriptive Statistics: Calculating the Mean in Various Data Series


The mean (average) is one of the most valuable and most frequently used measures in descriptive statistics. Why is it so widely used, and why is it important to know how to calculate the arithmetic mean? Perhaps the most convincing argument is that the mean is used in virtually every area of life.
With the arithmetic mean, you can calculate the average daily television viewing time for citizens of a given country, average volume of coffee drunk by a typical American, average annual temperature in your city, or the average amount you spend on food in a typical week. This article explains how to calculate this important statistic using the various types of series in statistics.
“Mean” and “Statistical” Keywords
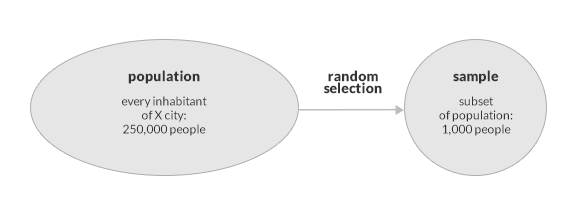
Before we describe how to calculate the arithmetic mean using the various data series, we will first discuss basic statistical concepts related to the mean. The arithmetic mean is a statistic used in descriptive statistics, a significant branch of the field which deals with the collection, analysis, compilation, and presentation of data. Descriptive statistics is based on population studies. What is the meaning of “population” in statistics, then? It is a complete set of phenomena, people, or things that are the subject of a given study. If we wish to investigate salaries among all 250,000 residents of city X, the residents constitute the population. A single resident is a statistical unit. The salary, in turn, is a characteristic of the population being studied. In order to find some statistical measures, such as the average salary among all residents of city X, one would first have to gather data regarding the salary of each resident. As there are 250,000 residents in city X, this would be a tedious and costly operation. Similarly, it would be difficult to study the whole population (by testing every specimen) in order to determine the strength of a given material.
This is why statistics makes use of samples. A sample is a subset of a given population that – although large at times – is much smaller that the population itself, making statistical study more manageable, less costly, and quicker. Sample data are selected randomly in order to provide a representative sample of the population. A statistical sample serves therefore as representation of a statistical population. Descriptive statistics investigates certain characteristics of populations based on entire populations or their subsets. In the example below, one such characteristic is salary. Our measurements of characteristics (salaries, in our case) are called observations.
Descriptive statistics uses “parameters” to describe a population, and “statistics” to describe a population sample.
Take a look at the picture below which presents the difference between the population of city X and its statistical sample.
The arithmetic mean is a parameter of the population and a statistic of the population sample.
In order to learn information about a substantial population, a statistical study may often be performed on a smaller, more manageable representative sample.
Mean of an Individual Data Series
The arithmetic mean is the most popular statistic belonging to a category of statistics known as measures of central tendency. It can be defined as the value around which all measurements of a given characteristic are distributed. It is applied only to quantitative characteristics, such as age, points, height, salary, or weight.
Suppose we would like to find the average number of hours students spent in baseball classes. Assume a sample size of 10 students are selected from the entire students’ population. Below we present a set of measurements containing the number of hours spent by the 10 students in baseball classes:
{ 10, 11, 12, 14, 15, 16, 17, 18, 18, 19, 20 }
Note that the number of hours spent in the classes varies among the students. The measurements are presented individually for each student. This is why such a data set is called an individual data series. An individual data series is, therefore, a set of all observations of a given characteristic, usually in ascending order.
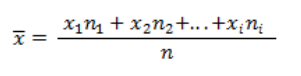
The arithmetic mean for this series is calculated by summing the values of the observations and dividing the result by the number of observations. Take a look at the formula below and the description of symbols used.
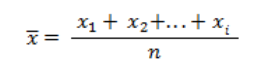
x – arithmetic mean for the sample
n – number of observations
x_i – ith observation of the characteristic
The number of observations in this case is 10, as we surveyed 10 students. The set that contains the number of hours for each student constitutes the values of the characteristic.
By substituting the values into the equation, we can calculate the arithmetic mean:
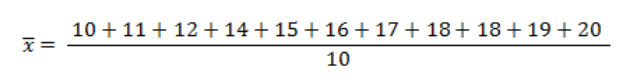
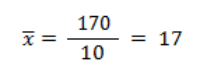
The calculations above show that the average number of hours spent in baseball classes by a single student is 17.
Mean of a Discrete Data Series
In the previous paragraph, we calculated the arithmetic mean for an individual data series. In this kind of series, the values for a given characteristic are listed for each sample unit. It is a good choice for sets with varying values of the characteristic and a small number of observations. However, what happens when values are frequently repeated in a given set of values for a given characteristic? In that case, it is better to use a discrete data series, which simplifies calculations. It is a series created by dividing all observations into groups. Each group represents a specific value of the characteristic. It is only possible when the values are discrete, i.e. they come from a countable set: age in years, points in a test. For each characteristic value identified, the number of its occurrences in the observation test should be provided.
This type of series is suitable when:
- the number of values in the observation set is small,
- the values are frequently repeated in the set,
- the values are related to a discrete characteristic.
Let us calculate the average number of points in an exam taken by 10 students in Grade 4. Possible exam scores were 0, 1, 2, 3, 4, or 5 points. Take a look at the set of observations:
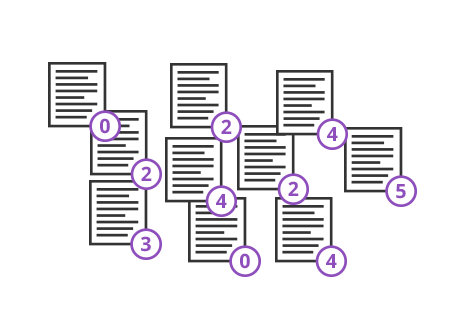
Our students got the following scores: 0, 2, 3, 4 and 5. The same values of the characteristic (i.e. number of points) are repeated among a few students. Points are a discontinuous characteristic. Instead of adding up all points from all students, we can simplify the calculations by dividing the observations into groups based on the exam score (number of points) and assigning the number of observations to each group. To that end, we can create a discrete series of scores, as shown in the table below:
| xi | ni |
|---|---|
| 0 | 2 |
| 1 | 0 |
| 2 | 3 |
| 3 | 1 |
| 4 | 3 |
| 5 | 1 |
| 10 |
We can see from the table that only one student got 5 points, but 3 students got 2 points. After multiplying each score by the number of students earning that score, we get intermediate results that can be used to calculate the final average.
| xi | ni | xini |
|---|---|---|
| 0 | 2 | 0 |
| 1 | 0 | 0 |
| 2 | 3 | 6 |
| 3 | 1 | 3 |
| 4 | 3 | 12 |
| 5 | 1 | 5 |
| 10 | 26 |
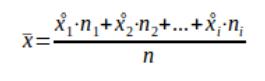
Take a look at the formula used to calculate the arithmetic mean for a discrete data series:
x – arithmetic mean for the sample
n – number of observations
x_i – ith value of the characteristic
n_i – number of observations for the ith value of the characteristic

Instead of summing all observations of the characteristic (as we did in our individual data series), we add up the products of all characteristic values (x sub i) and their number of occurrences (n sub i) in the discrete data series. We then substitute those products into the equation to obtain the average mean:
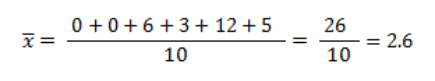
The average number of points obtained by a student in the exam was 2.6.
Remember!
The arithmetic mean calculated for a given set using an individual data series and a discrete data series will always be the same.
Mean of a Continuous Data Series
So far we have discussed which series can be used to calculate the arithmetic mean for a small set of values and for a set with a small number of distinct, recurring values. However, we may sometimes come across sets with many observations, many different values, or values that are unwieldy (such as precise measurements of height or precisely calculated salaries), for which it is difficult to create groups in order to calculate the mean of a discrete data series. In such cases we can use a continuous data series, which is well suited to continuous characteristics (for which measurements are precise and often expressed as decimal numbers). A continuous data series divides all values into groups but somewhat differently than the discrete data series. Each grouping of observations represents not a specific value but a range of values.
Let’s find the average salary among all employees. The measurement set consists of salaries for individual employees. Measured values fall between $1,000 and $5,000 (inclusive), which represents employee salary range. The measurements were performed for 100 employees. There are numerous salary values – each employee has a slightly different salary. In this case, we can create several intervals and count the number of employees whose salaries fall into each interval. Take a look at the table below, which presents a continuous data series.
| xi | ni |
|---|---|
| 1,000 – 2,000 | 40 |
| 2,000 – 3,000 | 0 |
| 3,000 – 4,000 | 50 |
| 4,000 – 5,000 | 10 |
| 100 |
In a continuous data series, we create equal intervals. In the example above, the range of each interval equals $1,000. For each interval, we show not only the range, but also the number of observations and the center point. The center point is calculated by adding the lowest and greatest values of the interval and dividing the result by 2. For each interval, we calculate the product of the center point and number of observations, which is then used to find the arithmetic average.
| xi | ni | x | nix |
|---|---|---|---|
| 1,000 – 2,000 | 40 | 1,500 | 60,000 |
| 2,000 – 3,000 | 0 | 2,500 | 0 |
| 3,000 – 4,000 | 50 | 3,500 | 175,000 |
| 4,000 – 5,000 | 10 | 4,500 | 135,000 |
| 100 | 280,000 |
Take a look at the formula.
x – arithmetic mean for the statistical sample
n – number of observations
n_i – number of observations for the ith interval
x_i – center of the ith interval
We complete the equation by substituting the calculated products:
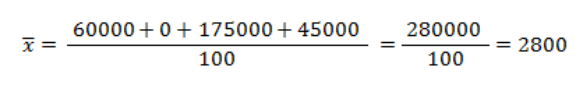
The average salary in the company equals $2,800.
Remember!
The arithmetic mean for a continuous data series is always approximate.
The broader the intervals, the less accurate the average.
On the other hand, if there are too many intervals, the data become less clear.
Summary
The arithmetic mean is a measure of central tendency in descriptive statistics which shows the average value of a characteristic in a given statistical sample. It is the most popular measure, vitally important, and applied in virtually every area of life. It can be calculated only for quantitative characteristics. A change in any single value in the set of characteristics results in a change in the arithmetic mean. This statistic is also sensitive to outliers. In order to easily calculate the arithmetic mean, we can use one of the following data series, selected based on the set of values of the given characteristic: individual data series, discrete data series, or continuous data series.