Deals Of The Week - hours only!Up to 80% off on all courses and bundles.-Close
Introduction
Reports with revenue in categories
Revenue in time periods for selected categories
Summary

Instruction

Very well done! Now, our previous report showed the categories as columns and the time periods as rows. We can switch this, showing the time periods as columns and the categories as rows. The report will look like this:

category_name overall_category_revenue revenue_2016 revenue_2017 revenue_2018
Confections 167357.26 29685.56 82657.75 55013.95
Meat/Poultry 163022.37 28813.66 80975.12 53233.59
Produce 99984.57 13885.78 54940.76 31158.03

Take a look at the query:

SELECT
  category_name,
  SUM(oi.amount) AS overall_category_revenue,
  SUM(CASE WHEN order_date >= '2016-01-01' AND order_date < '2017-01-01' THEN oi.amount ELSE 0.0 END) AS revenue_2016,
  SUM(CASE WHEN order_date >= '2017-01-01' AND order_date < '2018-01-01' THEN oi.amount ELSE 0.0 END) AS revenue_2017,
  SUM(CASE WHEN order_date >= '2018-01-01' AND order_date < '2019-01-01' THEN oi.amount ELSE 0.0 END) AS revenue_2018
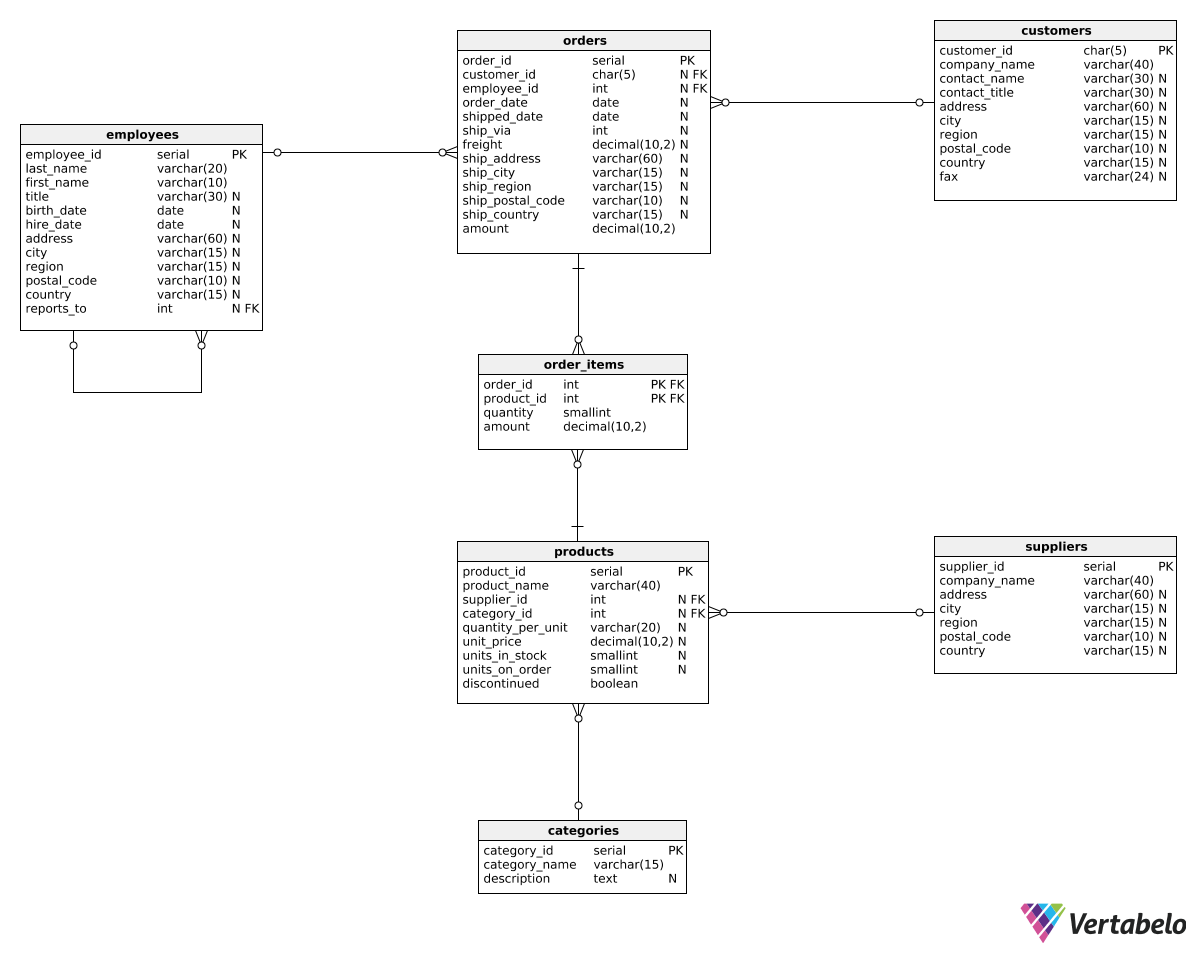
FROM order_items oi 
JOIN orders o
  ON oi.order_id = o.order_id
JOIN products p
  ON p.product_id = oi.product_id
JOIN categories c
  ON c.category_id = p.category_id
GROUP BY
  c.category_id,
  category_name;

This time we don't group by time periods. Instead, we group by product categories. On the other hand, we have to define separate columns, using SUM(CASE WHEN...) for each period we want to compare.

This report format is useful when we have many categories to compare but few time periods.

Exercise

Show the category revenue for each quarter of 2017. Show the following columns: category_name, overall_category_revenue, revenue_Q1, revenue_Q2, revenue_Q3, and revenue_Q4.

Stuck? Here's a hint!

You can check if a given order was placed in Q1 by using:

SUM(CASE
  WHEN EXTRACT(quarter FROM order_date) = 1
    THEN oi.amount
  ELSE 0.0
END) AS revenue_Q1

Remember about filtering the rows for orders from 2017.