Deals Of The Week - hours only!Up to 80% off on all courses and bundles.-Close
Introduction
Reports with revenue in categories
Revenue in time periods for selected categories
Summary

Instruction

Well done! We can create another version of the same report, this one showing revenue deltas. We'd like to get a report like this:

category_name overall_category_revenue revenue_2016 change_2017 change_2018
Confections 167357.26 29685.56 52972.19 -27643.80
Meat/Poultry 163022.37 28813.66 52161.46 -27741.53

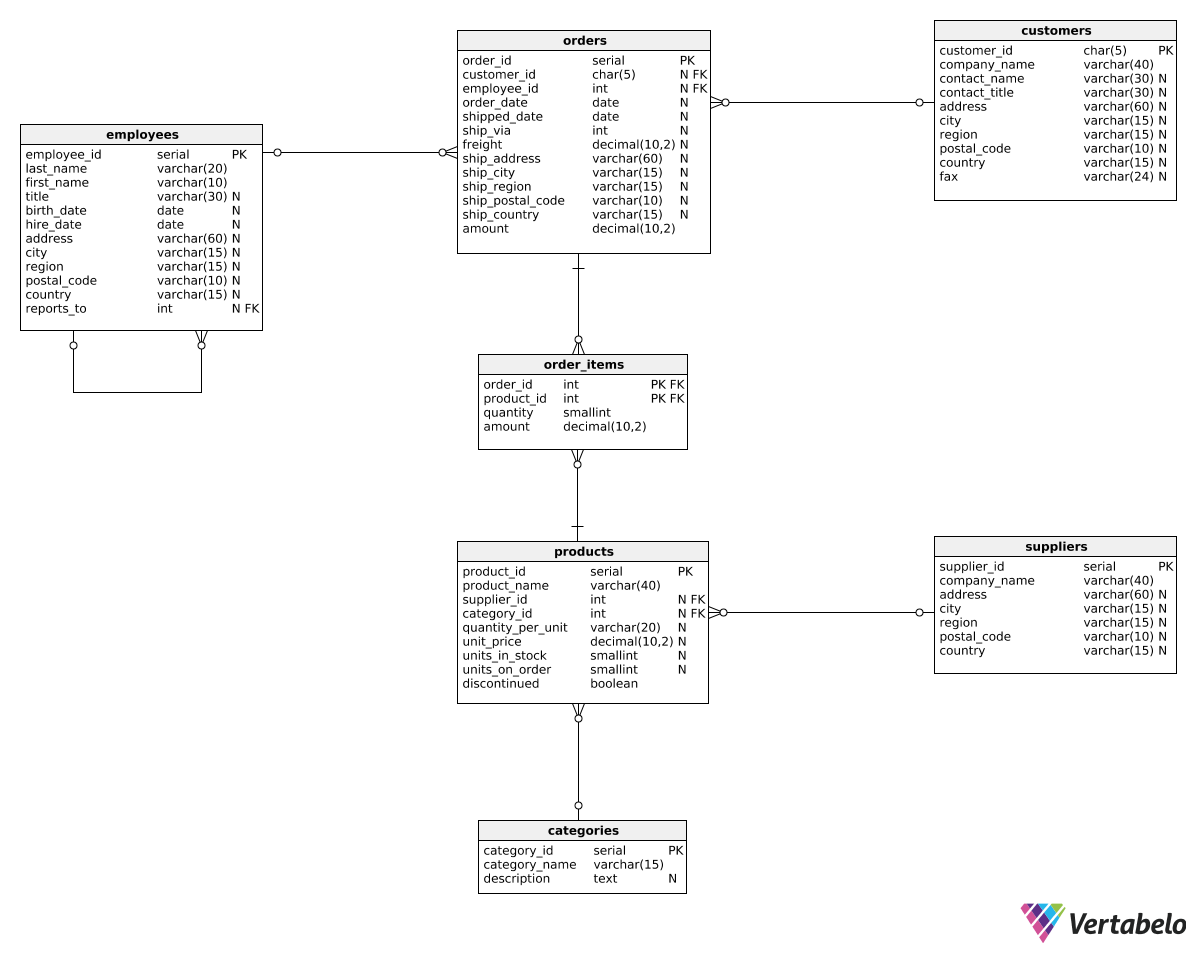
To that end, we can use the query below:

SELECT
  category_name,
  SUM(oi.amount) AS overall_category_revenue,

  SUM(CASE WHEN order_date >= '2016-01-01' AND order_date < '2017-01-01' THEN oi.amount ELSE 0.0 END) AS revenue_2016,

  SUM(CASE WHEN order_date >= '2017-01-01' AND order_date < '2018-01-01' THEN oi.amount ELSE 0.0 END)
    - SUM(CASE WHEN order_date >= '2016-01-01' AND order_date < '2017-01-01' THEN oi.amount ELSE 0.0 END) AS change_2017,

  SUM(CASE WHEN order_date >= '2018-01-01' AND order_date < '2019-01-01' THEN oi.amount ELSE 0.0 END)
    - SUM(CASE WHEN order_date >= '2017-01-01' AND order_date < '2018-01-01' THEN oi.amount ELSE 0.0 END) AS change_2018

FROM order_items oi 
JOIN orders o
  ON oi.order_id = o.order_id
JOIN products p
  ON p.product_id = oi.product_id
JOIN categories c
  ON c.category_id = p.category_id
GROUP BY
  c.category_id,
  category_name;

As you can see, the last two columns subtract the previous year's sum from the current year's sum.

Exercise

Create a report similar to the one shown in the explanation. This time, however, show the revenue in the first quarter of 2017 and the revenue changes in the next three quarters of 2017. Show the following columns: category_name, overall_category_revenue_2017, revenue_2017_Q1, change_Q2, change_Q3, and change_Q4.

Stuck? Here's a hint!

In the WHERE clause, filter for orders from 2017. Then, use EXTRACT(quarter FROM order_date) to get orders from each quarter.