Deals Of The Week - hours only!Up to 80% off on all courses and bundles.-Close
Introduction
Reports with revenue in categories
Revenue in time periods for selected categories
Summary

Instruction

Perfect! Next, we'd like to compare revenue values in selected categories year-to-year, quarter-to-quarter, etc. This way, we can analyze whether the category revenue increases or decreases over time.

The report should look like this:

revenue_year total_revenue beverages_revenue seafood_revenue
2016 208083.98 47919.00 19391.23
2017 617085.27 103924.32 66959.22
2018 440623.93 116024.88 44911.30

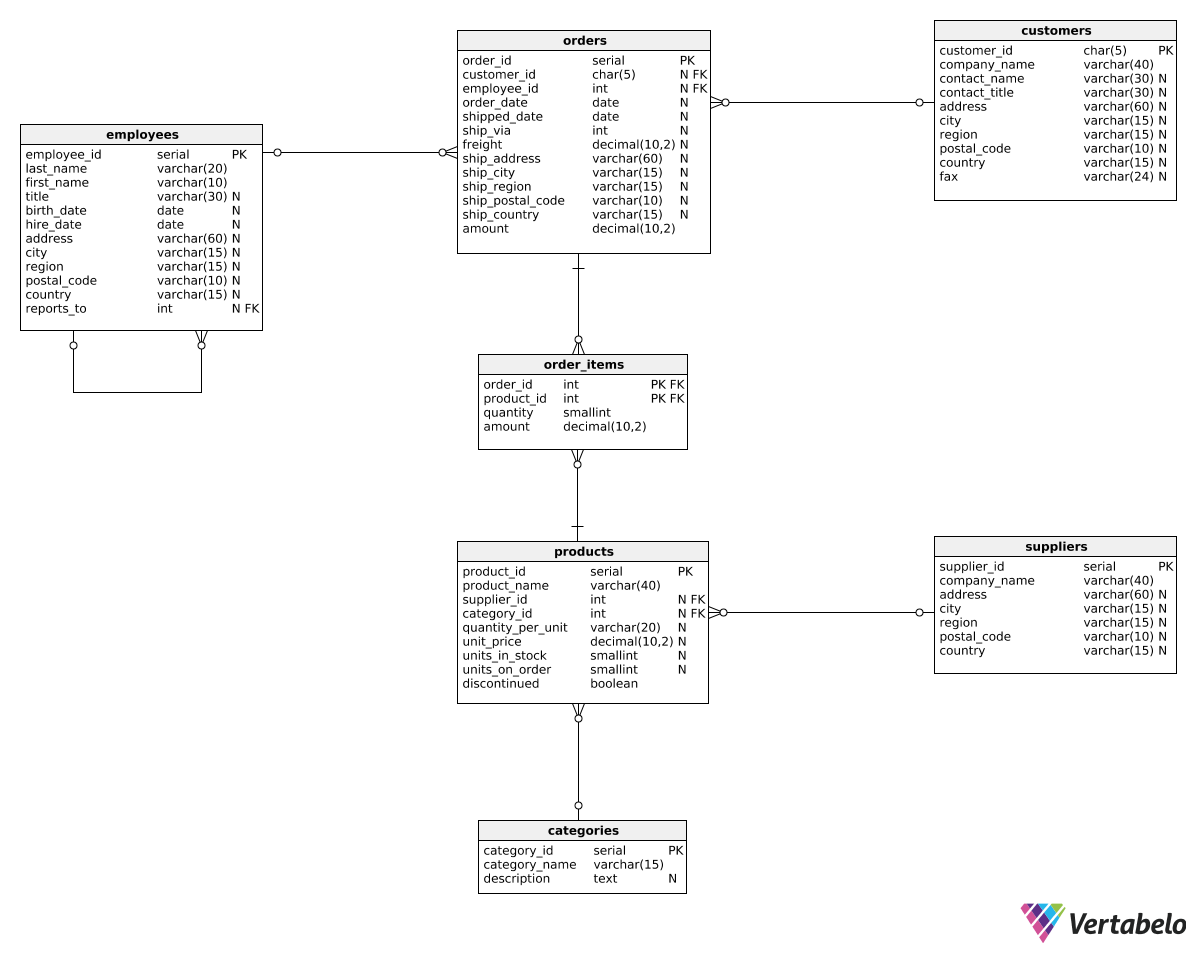
We could use the following query:

SELECT 
  EXTRACT(year FROM order_date) AS revenue_year,
  SUM(oi.amount) AS total_revenue, 
  SUM(CASE
    WHEN c.category_name = 'Beverages'
      THEN oi.amount
    ELSE 0.0
  END) AS beverages_revenue,
  SUM(CASE
    WHEN c.category_name = 'Seafood'
      THEN oi.amount
    ELSE 0.0
  END) AS seafood_revenue 
FROM order_items oi 
JOIN orders o
  ON oi.order_id = o.order_id
JOIN products p
  ON p.product_id = oi.product_id
JOIN categories c
  ON c.category_id = p.category_id
GROUP BY EXTRACT(year FROM order_date)
ORDER BY EXTRACT(year FROM order_date);

As you can see, the second column contains the total revenue, which is a simple SUM() of all the values in the amount column. However, we also added two columns which use the SUM(CASE WHEN...) construction. These will select only the amount values for specific categories.

This type of report is typically used when there are few categories to compare over many reporting periods.

Exercise

For each year and quarter, calculate the revenue for the 'Condiments' and 'Confections' categories. Show the following columns: revenue_year, revenue_quarter, total_revenue, condiments_revenue, and confections_revenue. Order the results by year and quarter.

Stuck? Here's a hint!

You will need to use EXTRACT() twice in each of the SELECT, the GROUP BY and the ORDER BY clauses:

EXTRACT(year FROM order_date), EXTRACT(quarter FROM order_date)