Very well done! We can now create a new report type. It should look like this:
| year |
Q1 |
Q2 |
Q3 |
Q4 |
| 2016 |
0.00 |
0.00 |
79728.58 |
128355.40 |
| 2017 |
138288.95 |
143177.03 |
153937.78 |
181681.45 |
| 2018 |
298491.57 |
142132.33 |
0.00 |
0.00 |
In other words, we want to see quarterly revenue values in the form of a table, with rows representing years and columns representing quarters. Such reports can help us see seasonal trends in revenue values. For instance, Q4 revenues are typically higher because of holiday shopping. It would be much harder to spot such trends when quarters are shown below each other.
How do we write such a query? Take a look:
SELECT
  EXTRACT(year FROM order_date) AS year,
  SUM(CASE WHEN EXTRACT(quarter FROM order_date) = 1
  THEN amount ELSE 0 END) AS Q1,
  SUM(CASE WHEN EXTRACT(quarter FROM order_date) = 2
  THEN amount ELSE 0 END) AS Q2,
  SUM(CASE WHEN EXTRACT(quarter FROM order_date) = 3
  THEN amount ELSE 0 END) AS Q3,
  SUM(CASE WHEN EXTRACT(quarter FROM order_date) = 4
  THEN amount ELSE 0 END) AS Q4
FROM orders
GROUP BY EXTRACT(year FROM order_date)
ORDER BY EXTRACT(year FROM order_date);
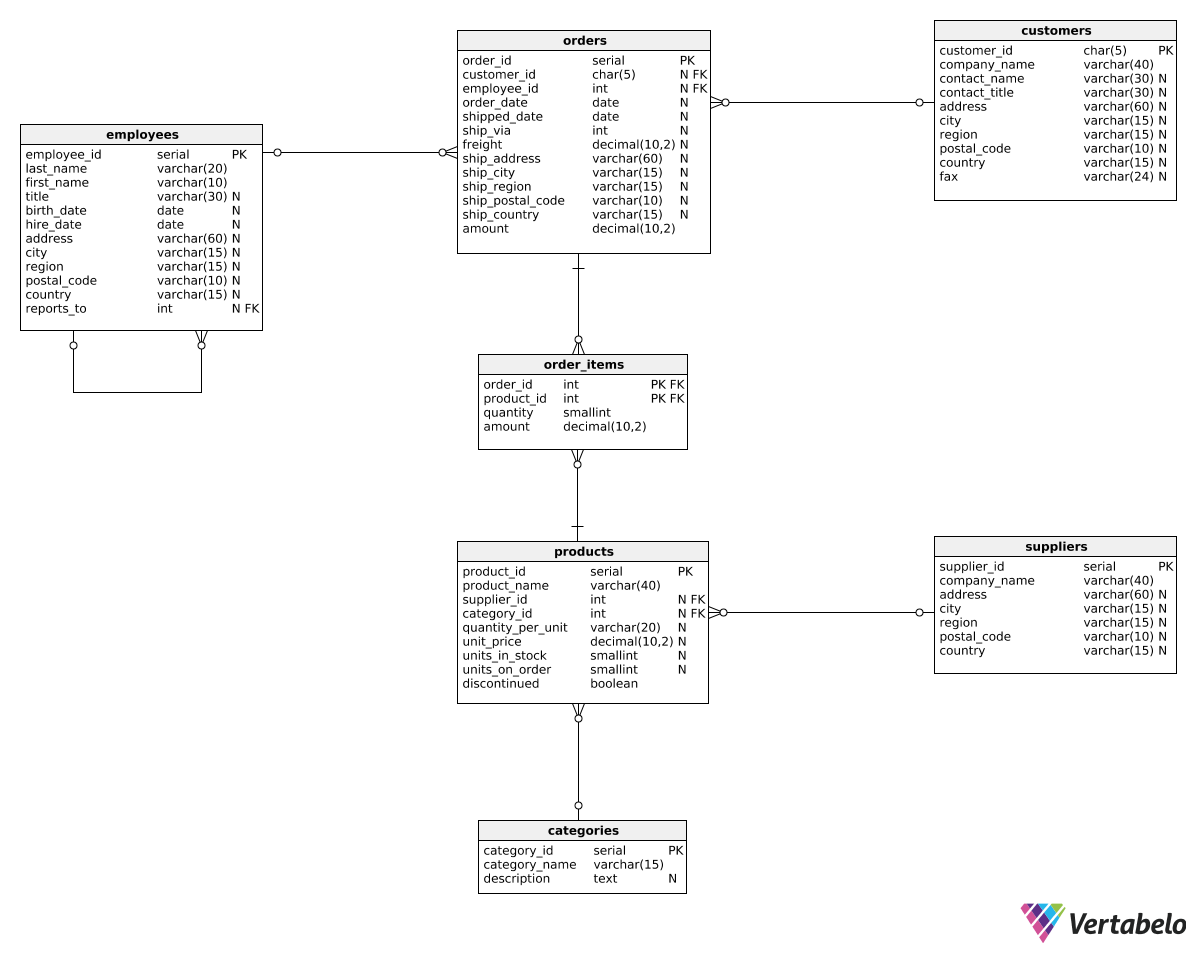
In the query above, we grouped all rows by the EXTRACT(year FROM order_date) value. This is something we've done before. However, we also used SUM(CASE WHEN...) expressions in the SELECT clause. In this case, the SUM(CASE WHEN...) expression first checks the quarter of the given order (EXTRACT(quarter FROM order_date) = X). If the quarter value matches the value for the given column, the order's amount is added. Otherwise, we add 0. This way, Q1 will only sum orders from the first quarter, Q2 will only sum orders from the second quarter, etc.


