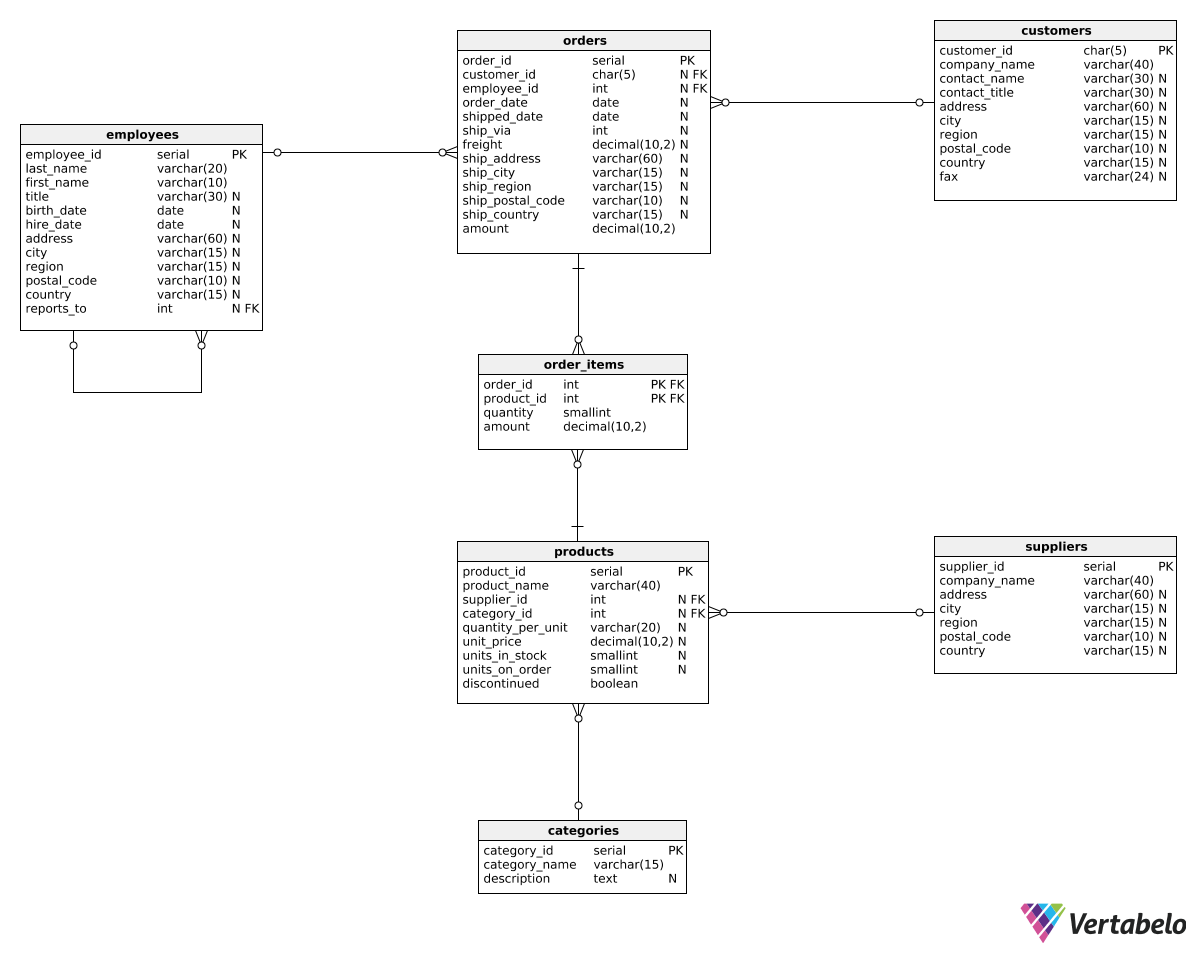
The next type of report we'd like to discuss calculates the revenue change between two periods. Such reports can help us assess whether revenue increases or decreases over time, and to what extent. We first need to learn how to show the revenue from the previous period for each row. Take a look:
SELECT
  EXTRACT(year FROM order_date) AS revenue_year,
  SUM(amount) AS total_revenue,
  LAG(SUM(amount), 1) OVER(ORDER BY EXTRACT(year FROM order_date)) AS previous_year_revenue
FROM orders
GROUP BY EXTRACT(year FROM order_date)
ORDER BY EXTRACT(year FROM order_date);
Here is the result:

As you can see, the report shows the total revenue for 1) each year and 2) the previous year. To do this, we used the LAG() function with an OVER() clause. LAG() shows values from row(s) that precede the current row. In this context, OVER() defines which rows are considered the "preceding rows". The statement:
LAG(SUM(amount), 1) OVER (ORDER BY EXTRACT(year FROM order_date))
means: order all rows by the year (OVER (ORDER BY EXTRACT(year FROM order_date))), sum order values for each year (SUM(amount)) and take the value from the previous year (LAG(SUM(amount), 1)). The expression may look difficult, but it helps to remember it as a fixed pattern.
Note: LAG() and OVER() are used in window functions. To get a deeper understanding of how these work, see our Window Functions course.


