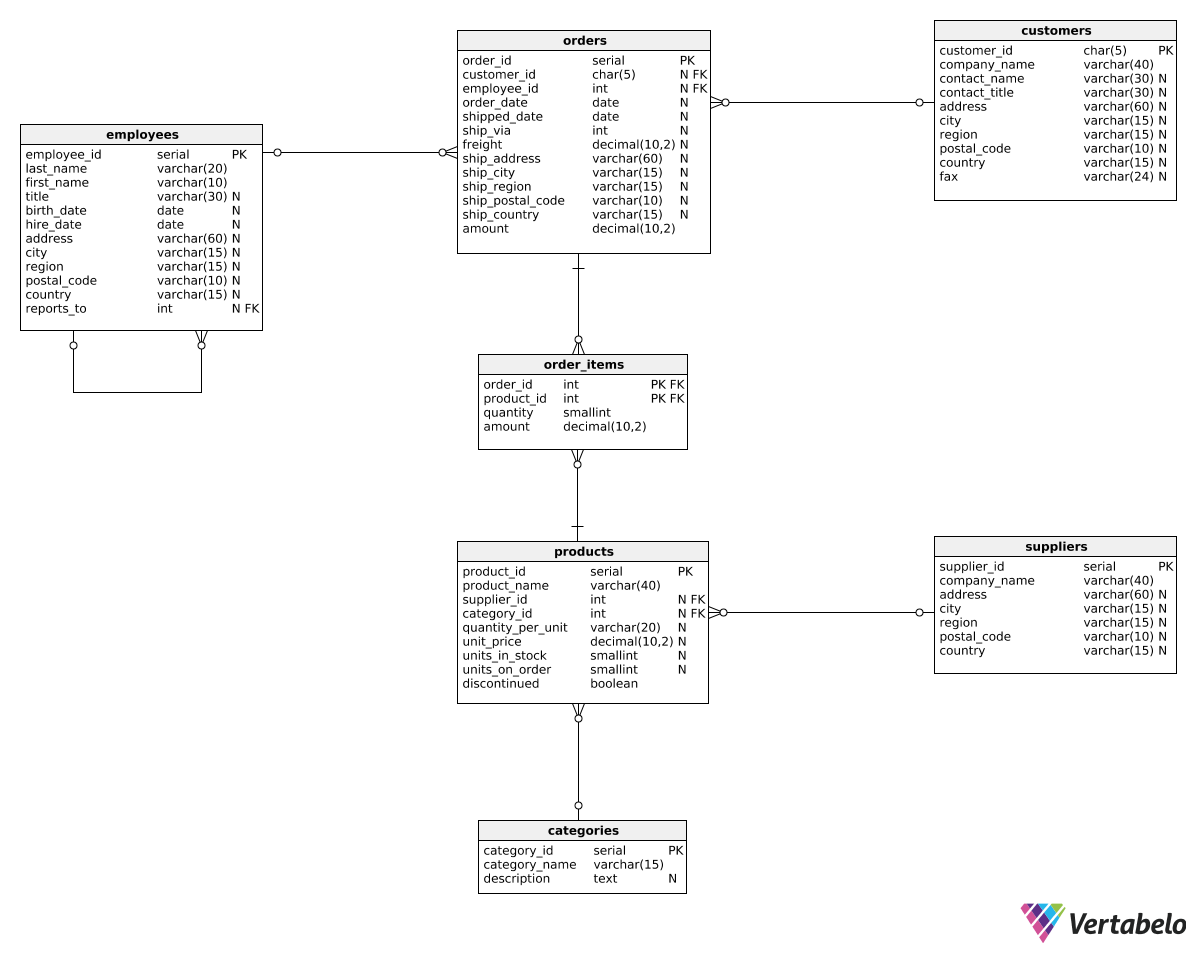
First, let's see how our revenue has changed over time. To do so, we'll compare revenue values between consecutive years, months, or any other time periods. Such reports are commonly called year-to-year, quarter-to-quarter, and month-to-month reports. In SQL, we can use the EXTRACT() function we've seen in Part 1 to create such reports. Take a look:
SELECT
  EXTRACT(year FROM order_date) AS revenue_year,
  SUM(amount) AS total_revenue
FROM orders
GROUP BY EXTRACT(year FROM order_date)
ORDER BY EXTRACT(year FROM order_date);
And the result:
| revenue_year |
total_revenue |
| 2016 |
208083.98 |
| 2017 |
617085.21 |
| 2018 |
440623.90 |
As you probably remember, the EXTRACT(time_unit FROM date) function takes two parameters: a time_unit (such as year, quarter, month, etc.) and a date or time column. The function returns the specified part of a given date.
In our example, EXTRACT(year FROM order_date) returns the year when the order was placed (2016, 2017, or 2018). As you can see, we also use the EXTRACT() function to group all the orders and sum the revenue values for each year.
Note that we also added an ORDER BY clause to make sure the revenue values are shown in chronological order.


