Introduction
Course Recap
Final challenge
Summary
Instruction
Excellent! Now, all that's left is a simple plot to draw!
Exercise
Use the DataFrame provided to create the following plot:
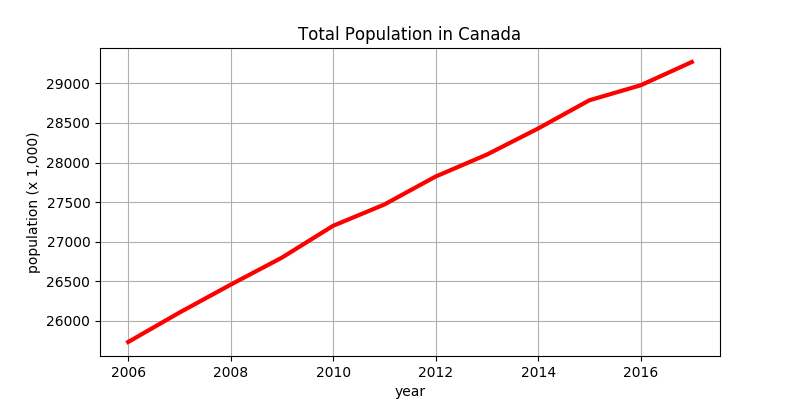
- Use a figsize of 8x4.
- For the line, use a "red" color with a linewidth of 3.

