Introduction
Course Recap
Final challenge
Summary
Instruction
Great! It's time to draw some plots!
Exercise
We want to see how price_per_person relates to overall_satisfaction. Draw the following scatter plot:
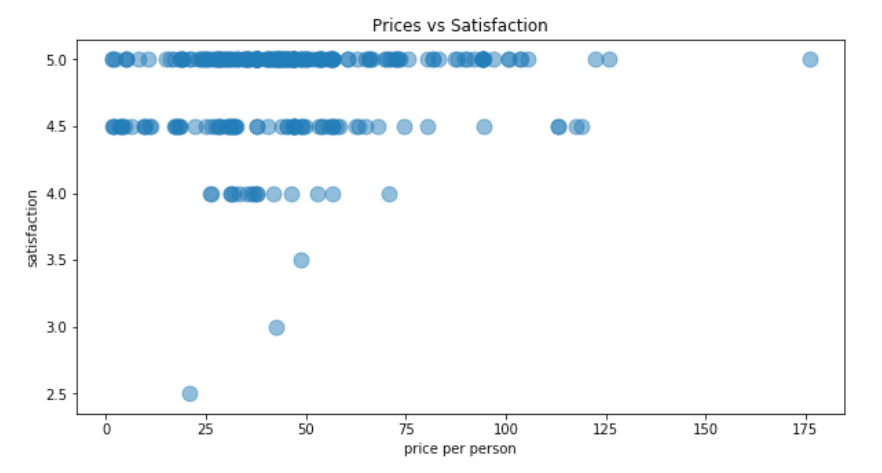
Use the following settings:
- figsize 10 x 5,
- transparency 50%,
- point size 120,
- marker 'o'.
- Only consider offers with
overall_satisfaction > 0.
Stuck? Here's a hint!
Create a temporary DataFrame:
airbnb_dataset_filtered = airbnb_dataset[airbnb_dataset.overall_satisfaction > 0]
To draw a scatter plot, use plt.scatter().

