Introduction
Course Recap
Final challenge
Summary
Instruction
Perfect! One more to go.
Exercise
Draw the following histogram for the price_per_person column:
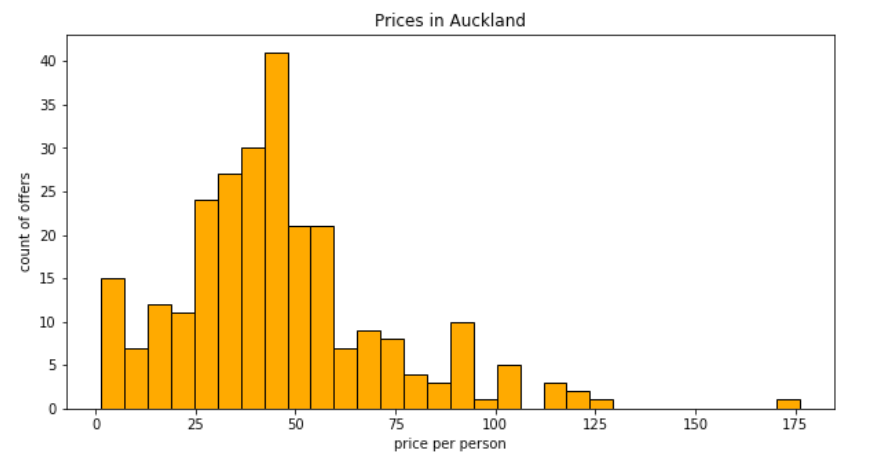
Use the following settings:
figsize=(10,5),facecolor='orange',edgecolor='black',bins=30,- Only consider offers with
overall_satisfaction > 0.
Stuck? Here's a hint!
To draw a histogram, use plt.hist().

