The year variable can naturally be interpreted as categorical – an ordinal variable, to be precise. Let's visualize it with a chart intended for categorical data: the bar chart. First, we will see how to create a bar chart that captures this data, then we will discuss the advantages and disadvantages of this approach.
A time series bar chart only differs from a normal bar chart in one key area: it uses a time axis to replace the horizontal (categorical) axis. So what is a 'time axis'?
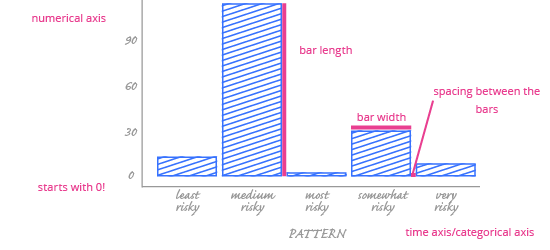
A time axis helps us manage the dual nature of time variables. It takes all the values of the time variable, but it treats them according to how we're using them. If we're using time as a categorical variable, the time axis serves as the categorical axis(in the chart above, that's the horizontal axis). If we're using time as a numerical variable, then it serves as the numerical axis.
A time axis is strictly related to time, so both approaches preserve two important time features:
- The values have order (e.g. successive dates – we always know where each date belongs on the axis).
- The intervals between adjacent values are equal (e.g. the difference between Monday and Tuesday (one day) is the same as between Wednesday and Thursday, and so on).
