Deals Of The Week - hours only!Up to 80% off on all courses and bundles.-Close
Introduction
Reports with revenue in categories
Revenue in time periods for selected categories
Summary

Instruction

Great work! We can also create another version of this report by changing revenue values into revenue deltas. The end result should look like this:

RevenueYear TotalRevenueDelta BeveragesRevenueDelta SeafoodRevenueDelta
2016 null null null
2017 409001.29 56005.32 47567.99
2018 -176461.34 12100.56 -22047.92

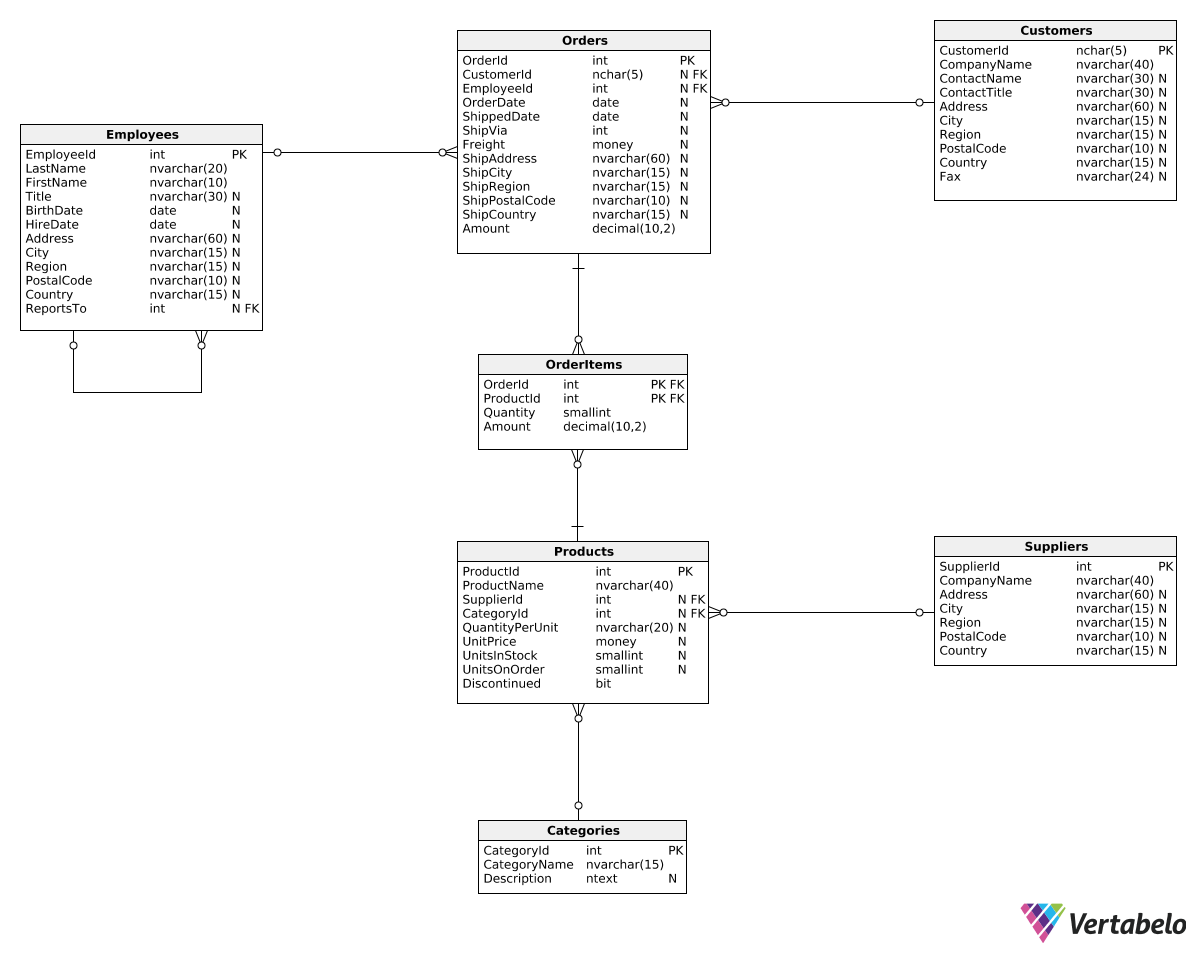
We can use the following query:

SELECT 
  DATEPART(Year, OrderDate) AS RevenueYear,
  SUM(OI.Amount) - LAG(SUM(OI.Amount)) OVER (ORDER BY DATEPART(Year, OrderDate)) AS TotalRevenueDelta, 
  SUM(CASE WHEN C.CategoryName = 'Beverages' THEN OI.Amount ELSE 0.0 END)
  - LAG(SUM(CASE WHEN C.CategoryName = 'Beverages' THEN OI.Amount ELSE 0.0 END)) OVER (ORDER BY DATEPART(Year, OrderDate)) AS BeveragesRevenueDelta,
  SUM(CASE WHEN C.CategoryName = 'Seafood' THEN OI.Amount ELSE 0.0 END)
  - LAG(SUM(CASE WHEN C.CategoryName = 'Seafood' THEN OI.Amount ELSE 0.0 END)) OVER (ORDER BY DATEPART(Year, OrderDate)) AS SeafoodRevenueDelta 
FROM OrderItems OI 
JOIN Orders O
  ON OI.OrderId = O.OrderId
JOIN Products P
  ON P.ProductId = OI.ProductId
JOIN Categories C
  ON C.CategoryId = P.CategoryId
GROUP BY DATEPART(Year, OrderDate)
ORDER BY DATEPART(Year, OrderDate);

We now calculate each column as the sum from the current year (SUM(OI.Amount)) minus the sum from the previous year (LAG(SUM(OI.Amount)) OVER (ORDER BY DATEPART(Year, OrderDate))). To that end, we used the LAG() OVER() pattern we learned in the previous part.

Exercise

Create a report similar to the one shown in the explanation. This time, however, show the revenue changes in the four quarters of 2017 for the Produce and Confections categories. Show the following columns: RevenueQuarter, TotalRevenueDelta, ProduceRevenueDelta, and ConfectionsRevenueDelta.

Stuck? Here's a hint!

Use a WHERE clause to filter the orders from 2017. Then, use DATEPART(Quarter, OrderDate).