Before learning about chart types and how to build them, we need to understand the meaning of data visualization. This is not just selecting a nice, pre-designed template in Excel. It depends on many factors, some of which we may sometimes overlook. These factors include:
- Who is your audience? To whom will you present your chart? Would you present the same chart to the general public as you would to subject experts? Probably not. You'd add explanatory information to the general public's chart, wouldn't you? For the experts, you might include more technical information or a greater level of detail.
- How will you use your chart? Do you want to draw attention to the most important conclusion of your analysis? Or are you just simply presenting the data and letting others draw the conclusions?
Obviously, the answers to these two questions will determine how you structure your chart and what information you include in it. Plus, there are other factors that will affect how you create your visualization.
What won't change is the process of data visualization. There will always be four main stages of any visualization project. We've broken them down in the image below:
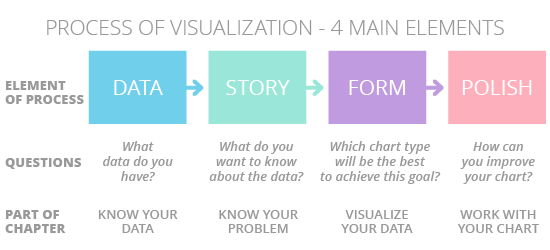
Remember, data visualization is a process, but it doesn't necessarily come with a defined ending. We're always getting more and newer data, so you can always look for additional data to enrich your chart. Or you can consider other ways to analyze or present it. The better you know the data, the better ideas you'll get.
What are we going to do in this chapter?
The next four parts of this chapter will introduce you to each step in the data visualization process: data, story, form, and polish.
Next, we'll acquaint you with R, a programming language used to develop data visualizations (among other things). Throughout this course, you'll use R to create and refine your charts and graphs.
Once you understand these two things, you can move on to the first chapter. We'll show you, step by step, how to use the data visualization process and the R programming language to create your own versions of popular charts.
Ready? Let's dig in!
