In data visualizations, we usually work with two types of variables: numerical and categorical. These types can each be divided into two subtypes:
Numerical variables present anything you can measure or count. The fancy name for this is "quantitative". They answer questions like "How much?" or "How many?". Numerical variables can be divided into two subtypes:
Ratio numerical values have fixed zero points and can be divided. Price is an example of this type of variable; you can say that my car is two times cheaper than his car and that you got an oil change for free (so the price equals zero).
Interval numerical values are numbers without a fixed zero; these cannot be divided. For example, the temperature outside may be 0, but that does not mean there is no temperature. In interval variables, the value between variables will not change because of the value of the variables themselves. For example, on a Celsius or Fahrenheit thermometer, a ten-degree difference will always be a ten-degree difference no matter what the temperatures are.
Categorical variables describe data by characteristics or qualities. The fancy word for this is "qualitative". Categorical values divide the dataset into groups, and they answer questions like "What kind?" or "How is it described?". They can be divided into the following subtypes:
Ordinal categorical values have a built-in or inherent order. An example is the education system: "college postgraduate" > "college undergraduate" > "high school" > "middle school" > "elementary school". (Hint: Think of ordinal and order.)
Nominal categorical values are groups with no inherent order. An example is animals: "bird", "cat", and "dog". We can't say that "cat" is inherently more than "bird", or that "dog" naturally should be first. Of course, this doesn't mean you can't organize nominal variables by alphabetical order or in some other way; it means that the items themselves have no built-in rank. (Hint: Think of nominal and name.)
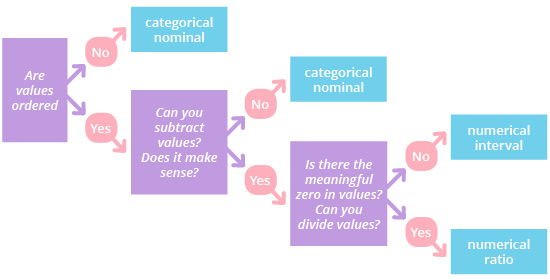
Here's something interesting about variable types: the same data point can be treated as different variable types. In other words, you can transform variables from one type to another. Take someone's height as an example. It might be described as a numerical ratio value (6 feet or 1.83 meters) or as a categorical ordinal value ("tall"). To help you understand which variables fit into which type, we've constructed a chart. Each box has questions that will lead you to the correct type for your variable. You can find it in the right sidebar, under "Types of variables". Have a look.
Now that we've become familiar with the different variable types we'll use in this course, let's practice identifying them!