Like quartiles, percentiles are measures of variability. However, instead of splitting the dataset into four parts, they break it down into a hundred parts (hence percentile, or per 100). The p-th percentile is the value below which p% of the observations are found. For the n-element set, the position of the p-th percentile is given by the formula:
where \lceil{x}\rceil is called a ceiling and is the least integer greater than or equal to x.
Percentiles are used quite often. For instance, there are growth charts for infants and children that illustrate common body measurements. The growth charts given by the United States' Centers for Disease Control and Prevention consist of a series of percentile curves, as shown below (click to enlarge):
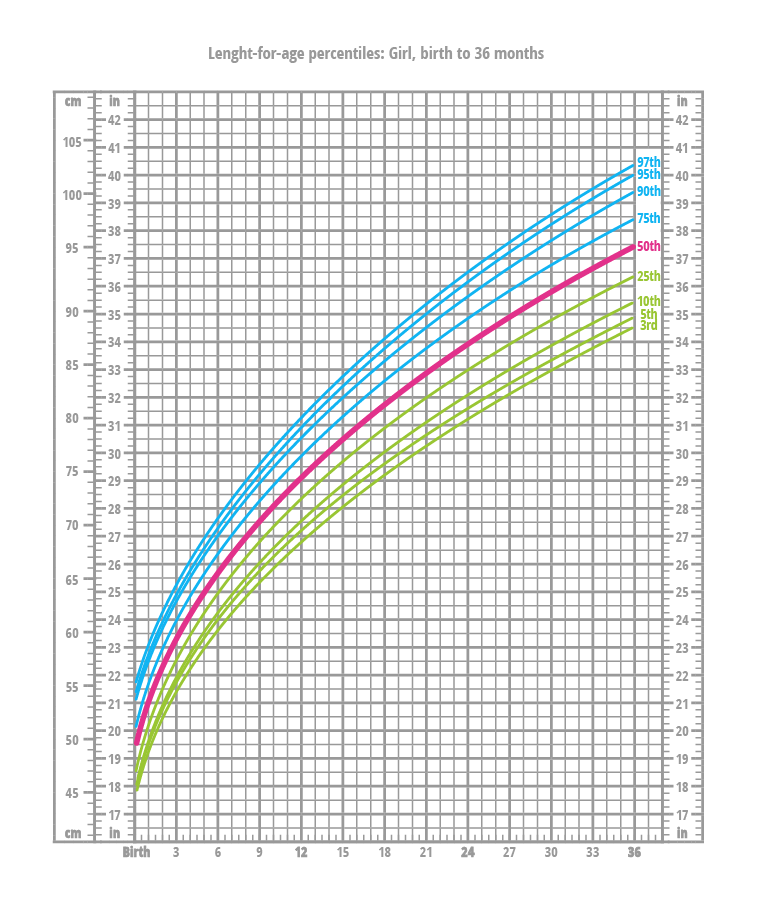
You can read the above chart this way: if a 12-month-old girl's length falls in the 90th percentile, then she is longer than 90% of 12-month-old girls.
