Instruction
We will start with a simple report that shows multiple metrics for the same business object. Let's say we need to show the number of products and the total price for each order. Take a look at the query below:
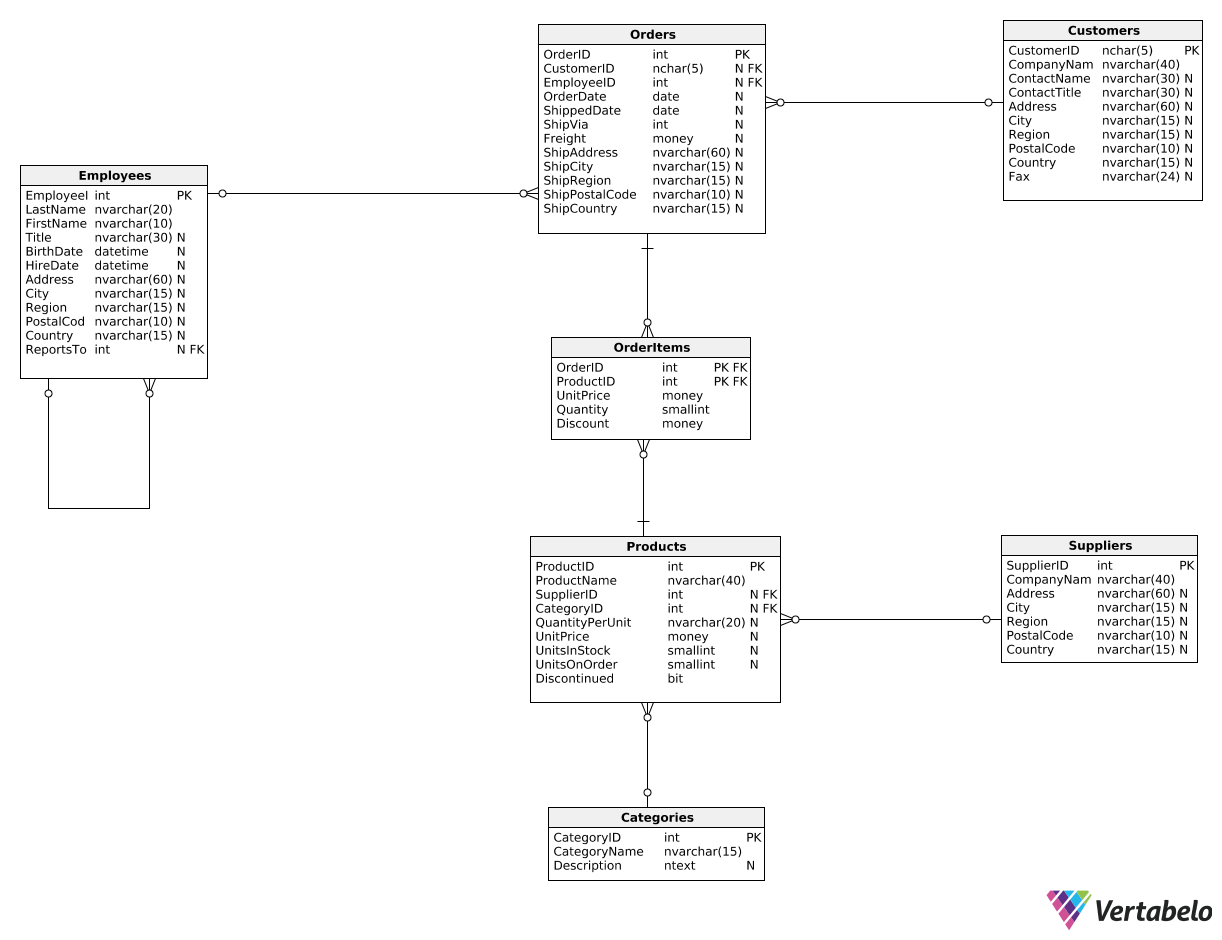
SELECT
  OrderID,
  COUNT(ProductID) AS Products,
  SUM(UnitPrice * Quantity) AS TotalPrice
FROM OrderItems
GROUP BY OrderID;
We use COUNT() and SUM() in two separate columns to show two different metrics for the same business object (i.e., for the same order). In this case, we used the OrderItems table to show the number of line items and the total price for each order. Note that we use the GROUP BY statement to compute metrics for different orders in one query.
Exercise
We want to see each customer's ID alongside the number of orders they placed and the total revenue (after discount) that their purchases generated generated for us. Show three columns:
- The customer's ID (
CustomerID). - The number of orders (as
OrderCount). - The total price paid for all orders after discounts (as
TotalRevenueAfterDiscount).
Stuck? Here's a hint!
Join two tables: Orders and OrderItems. Remember to group by CustomerID and to use DISTINCT when counting the number of orders. Calculate the TotalRevenueAfterDiscount column using SUM(UnitPrice * Quantity * (1 - Discount)).