Great! The final report type we'll talk about in this part shows what proportion of the whole each group represents.
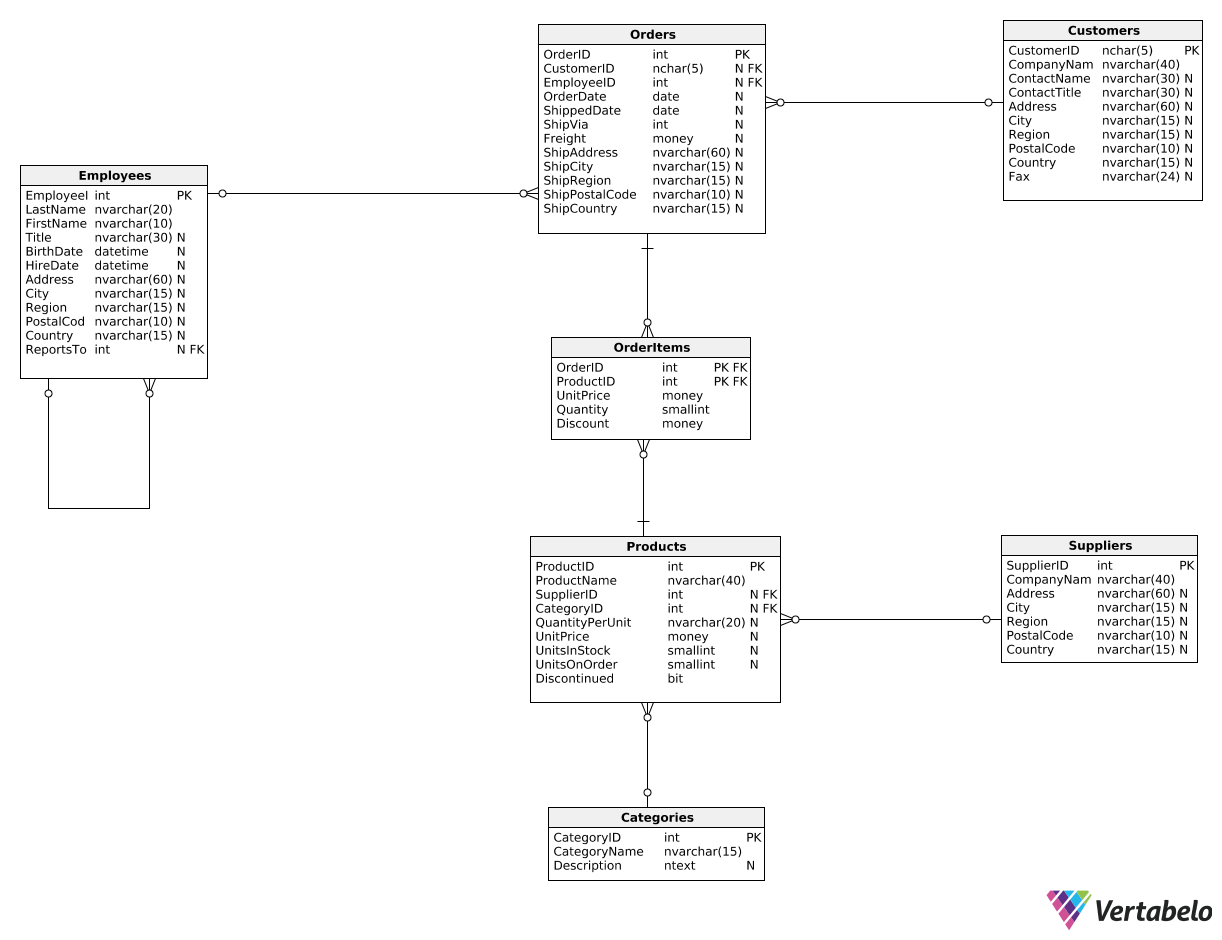
Suppose that we want to create a report that shows information about the customers who placed orders in July 2016 and the percentage of total monthly revenue each customer generated. We can use the following code:
WITH TotalSales AS (
  SELECT
    SUM(Quantity * UnitPrice) AS JulySales
  FROM OrderItems OI
  JOIN Orders O
    ON O.OrderID = OI.OrderID
  WHERE OrderDate >= '2016-07-01' AND OrderDate < '2016-08-01'
)
SELECT
  C.CustomerID,
  SUM(Quantity * UnitPrice) AS Revenue,
  ROUND(SUM(quantity * unitprice) / CAST(TotalSales.JulySales AS Float) * 100, 2) AS RevenuePercentage
FROM TotalSales,
  Customers C
JOIN Orders O
  ON C.CustomerID = O.CustomerID
JOIN OrderItems OI
  ON OI.OrderID = O.OrderID
WHERE OrderDate >= '2016-07-01' AND OrderDate < '2016-08-01'
GROUP BY C.CustomerID, TotalSales.JulySales;
In the CTE, we simply calculate the total monthly revenue from July 2016. In the outer query, we show each CustomerID alongside that customer's revenue in July 2016. But note what happens in the last column: We divide the customer's revenue (from the previous column) by the JulySales value from the CTE. This gives us the revenue percentage generated by a given customer.
Note that we had to add the JulySales column to the GROUP BY clause because it wasn't used with any aggregate function.
Naturally, the outer query only makes sense when it has the same WHERE clause as the inner query. Also, note that we join the TotalSales and the Customers tables in the following way:
FROM TotalSales, Customers C
This ensures that all rows (here, the only row) from the TotalSales CTE are combined with all rows from the Customers table. As a result, the JulySales value is available in all rows of the TotalSales-Customers combination.


