Welcome to the first part of our Data Visualisation course. In this part we'll learn how you can visualize the distribution of data.
Every proper data analysis begins with a detailed examination of the distribution of variables in the dataset. We'll start course the same way: by presenting the problem of distribution. We're going to use a very simple form of the distribution problem, but it will be similar enough to real-life applications that you'll be able to recognize and apply it later.
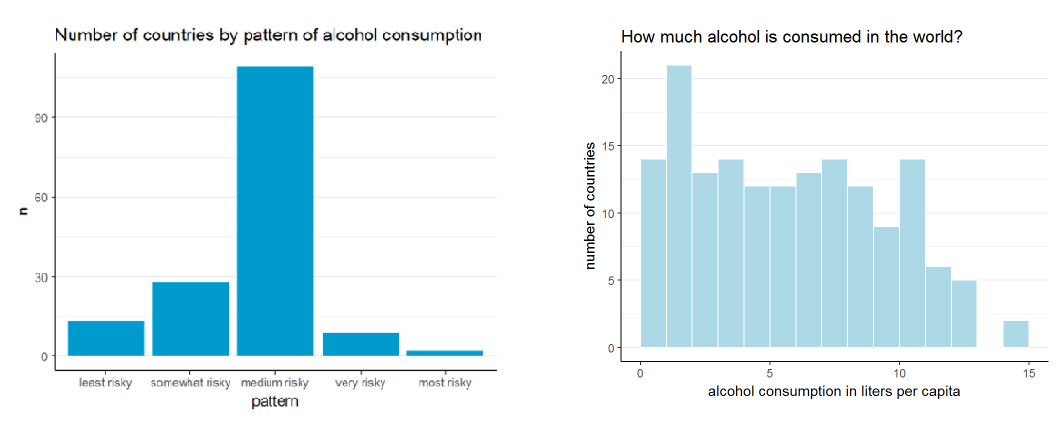
We'll also talk about different ways to visually present, or visualize, the data. We'll begin with the familiar bar chart (for categorical variables), and then move on to the histogram (for numerical variables).
Ready? Let's start by defining the distribution of variables!
