Instruction
Quartiles are the values that break up the dataset into quarters:
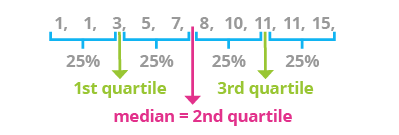
- The first quartile is the point below which a quarter of the data lie. It is sometimes called the lower quartile.
- The second quartile is the point below which half of the data lie. We already know this point by the name of median. It is also called the middle quartile.
- The third quartile is the point below which three-quarters of the data lie. It is called the upper quartile.
More generally, quantiles are cut points that divide a sample dataset into subgroups. For instance, if the 0.20 quantile equals 5, that means that 20% of all observations are less than or equal to 5, while the other 80% of observations are greater than 5.
The describe() function computes the 1st, 2nd and 3rd quartiles, but you can use the quantile() function to compute any kind of quantile you want. For instance:
players['aces'].quantile([0.2, 0.4, 0.6, 0.8])
The code above will compute the 5-quantiles (quintiles) of the "aces" column of the "players" DataFrame. Note that we provided a list of comma-separated values inside square brackets. In the code above, 0.2 stands for the 20th percentile, 0.4 stands for the 40th percentile, and so on.
Exercise
Compute the 10th, 20th, 80th and 90th percentiles of the rating column of the movies DataFrame.
Stuck? Here's a hint!
Use the following list of values:
[0.1, 0.2, 0.8, 0.9]

