Instruction
When you use histograms and bar charts, it is easy to see how the categories are proportioned. It is impossible, however, to explicitly plot measures of central tendency and dispersion. Box plots — also known as box-and-whisker diagrams – are ideal for showing these measures. A sample box plot is shown below.
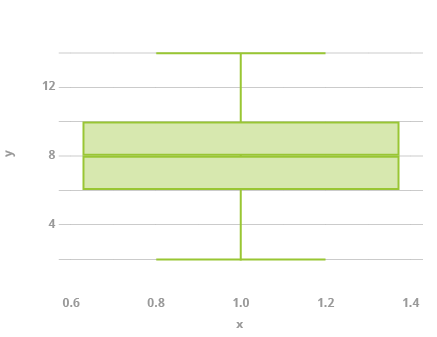
The bottom and top of the box represent the first and third quartiles. The bold line inside the box is the second quartile (the median). The ending whiskers (in the simplest case) represent the minimum and maximum values in the data.
For the example box plot we can see that the first quartile (bottom of the box) is 6, the third quartile (top of the box) is 10, and the median (bold line inside the box) is 8. The minimum of the dataset is 2 (the end of the bottom whisker), and the maximum of the dataset is 14 (the end of the top whisker).
