Nice job! R has a very useful function that allows you to compute multiple descriptive statistics in one call. This function is called summary(). If we type
summary(ages)
in our editor, R will print the following result:
 Min. 1st Qu.  Median   Mean   3rd Qu.    Max.
22.00   27.25   29.00  30.25     31.75   43.00
This function takes one argument (a vector) and returns the min, max, mean, median, and first and third quartiles.
A median is a value separating the upper and lower halves of an ordered set of elements. The median of the set 1, 2, and 3 is 2, because there is exactly one number greater than this element and one that is smaller. However if the number of elements in a set is even, the median is calculated by averaging the two central values.
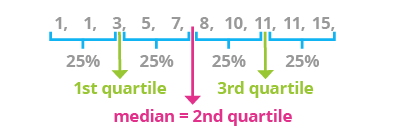
Quartiles are numbers which split data into fourths, just as in the picture above. The first quartile is the element that is greater than 25% of the values in the sequence but less than the remaining 75%. The median is the second quartile. The third quartile is the element that is greater than 75% of the values but less than the remaining 25%.
Obviously, R has functions which can calculate the median (the median() function) and quartiles (the quantile() function). You don't need to explicitly call such functions - R does all of that in summary().

