The next stop on our visualization journey is analyzing the composition of phenomena – or understanding the parts of a whole. We will focus here on the relationship between one or more parts and the entire composition, finding out what percentage of the whole one part constitutes.
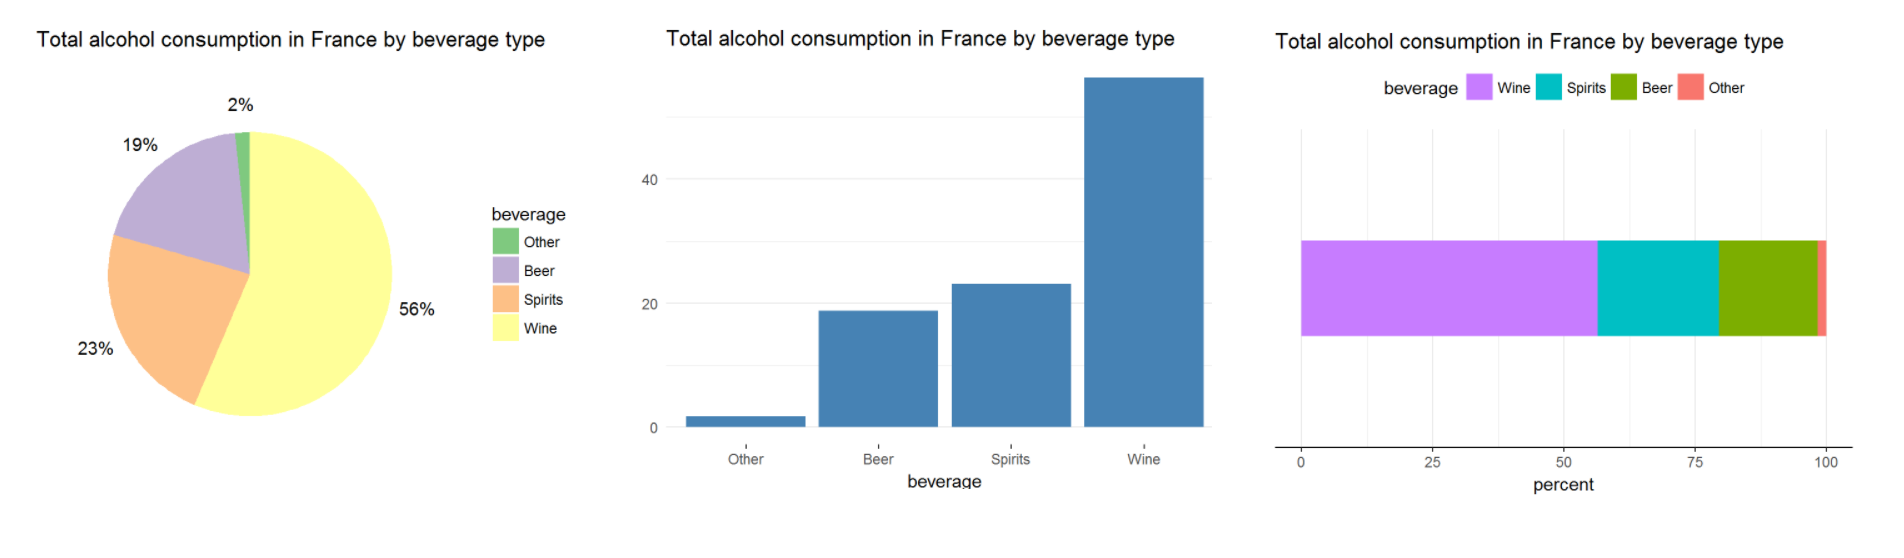
This and the next chapter will show us how to create two new charts: the pie chart and the 100% stacked bar chart. These are built on the idea of having one common area (representing the whole) and dividing it into pieces. We will also compare the effectiveness of each chart against the effectiveness of the bar chart (when used for the same story).