Excellent work – you’ve reached the end of another chapter! Before we continue, let’s review how the mosaic plot can show the relationship between two categorical variables.
When you’re constructing a mosaic plot, use these tips:
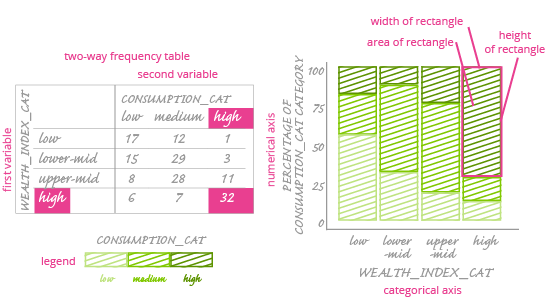
The order of variables on a mosaic plot is very important, even more important than it is for the scatter plot. Always put the explanatory variable on the the horizontal x-axis and the response variable on the vertical y-axis.
Use a sequential color scale (one that has a natural progression between the colors, like light to dark, and that has an inherent order) for the ordinal variable.